
























01Urban rainfall intelligence

Read the Rain. Protect What Matters.

We read the city’s rain more closely and bring flood response forward.

Field rainfall observation · flood risk analysis · monitoring and alerts. One platform.

  • Seoul Metropolitan GovernmentPublic & disaster safety
  • Gwanak-guPublic & disaster safety
  • Songpa-guPublic & disaster safety
  • Seodaemun-guPublic & disaster safety
  • Busan Metropolitan CityPublic & disaster safety
  • Korea Meteorological AdministrationPublic & disaster safety
  • National Fire AgencyPublic & disaster safety
  • Korean National Police AgencyPublic & disaster safety
  • Korea Expressway CorporationPublic & disaster safety
  • K-waterPublic & disaster safety
  • Korea Hydro & Nuclear PowerEnergy & infrastructure
  • KEPCOEnergy & infrastructure
  • Korea Southern PowerEnergy & infrastructure
  • Korea East-West PowerEnergy & infrastructure
  • KOMIPOEnergy & infrastructure
  • KEPCO KDNEnergy & infrastructure
  • Korea Institute of Civil Engineering and Building TechnologyResearch
  • Brooklyn Chamber of CommerceInternational
  • NASAInternational
  • State of New JerseyInternational
  • NYC Economic Development CorporationInternational
  • NYC Department of Environmental ProtectionInternational
  • Texas Economic Development CouncilInternational
  • Texas Economic Development CorporationInternational

Working with public agencies, energy, research and global partners

02The problem

Same city, different rain.

Local downpours can vary sharply within a few kilometers.

  • 01

    Observation gaps

    Rain between stations is an estimate. Alley- and underpass-level differences vanish in averages.

  • 02

    Decision time

    Several rounds of checking and calling between risk and response.

  • 03

    Link to action

    Without clear roles—who, where, what—action comes late.

03City scale

Denser. Closer.

01 / 04 · 2D · Side

Estimate from the sky, or measure on the ground

  • Weather radar: estimates rain from drops aloft
  • Can differ from ground rainfall with height and wind
  • Ground rain gauge: measures the rain that lands

02 / 04 · 3D · Today

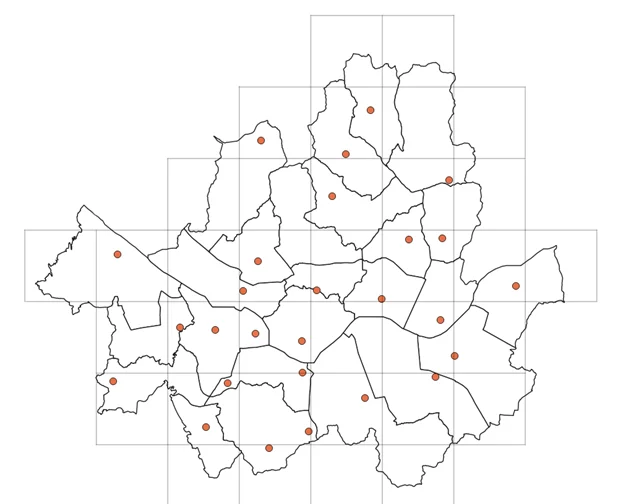
Today’s network: district by district

  • Seoul public network ≈ one per district
  • About one station per district
  • Alley- and underpass-level differences vanish in averages

03 / 04 · 3D · WOOZZA

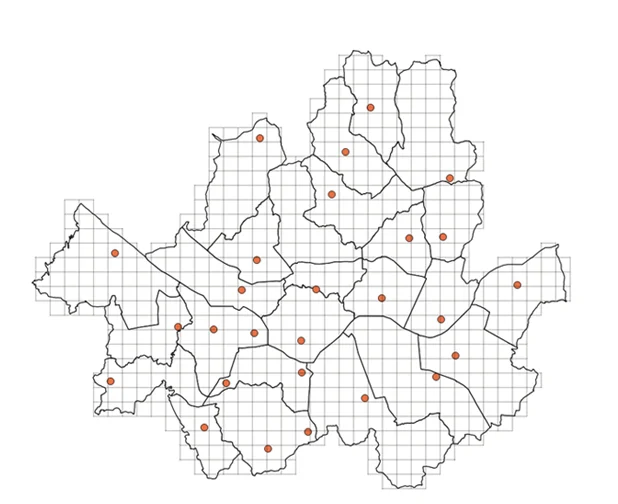
WOOZZA network: neighborhood by neighborhood

  • Gauges placed at neighborhood level
  • 1-minute rainfall at every point
  • Point-by-point differences within one storm

04 / 04 · 2D · Top

From above: 12 km → 1 km

  • Public network grid ≈ 12 km
  • WOOZZA network grid 1 km
  • Rainfall data fitted to each site

04WOOZZA Platform

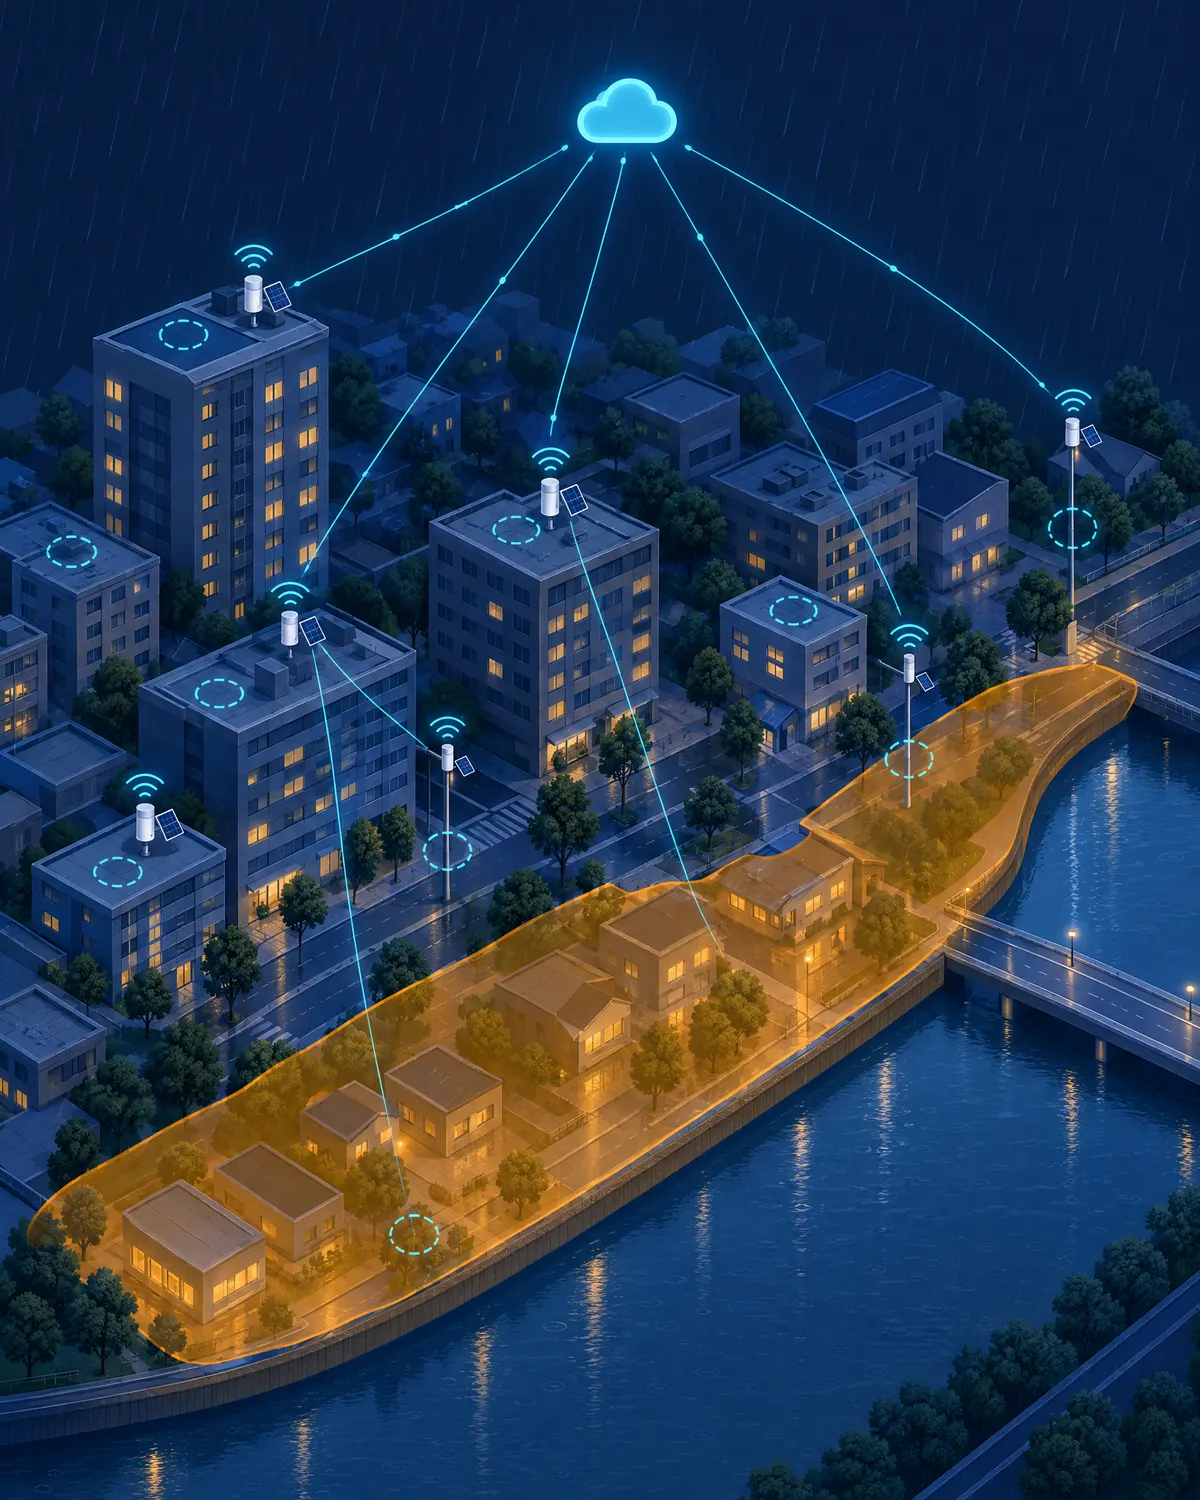
From observation to response, in one flow.

Observe → quality control → risk analysis → alert → response. Tap a card to see each step.

See how it works →

  1. 01INGEST

    Field observation

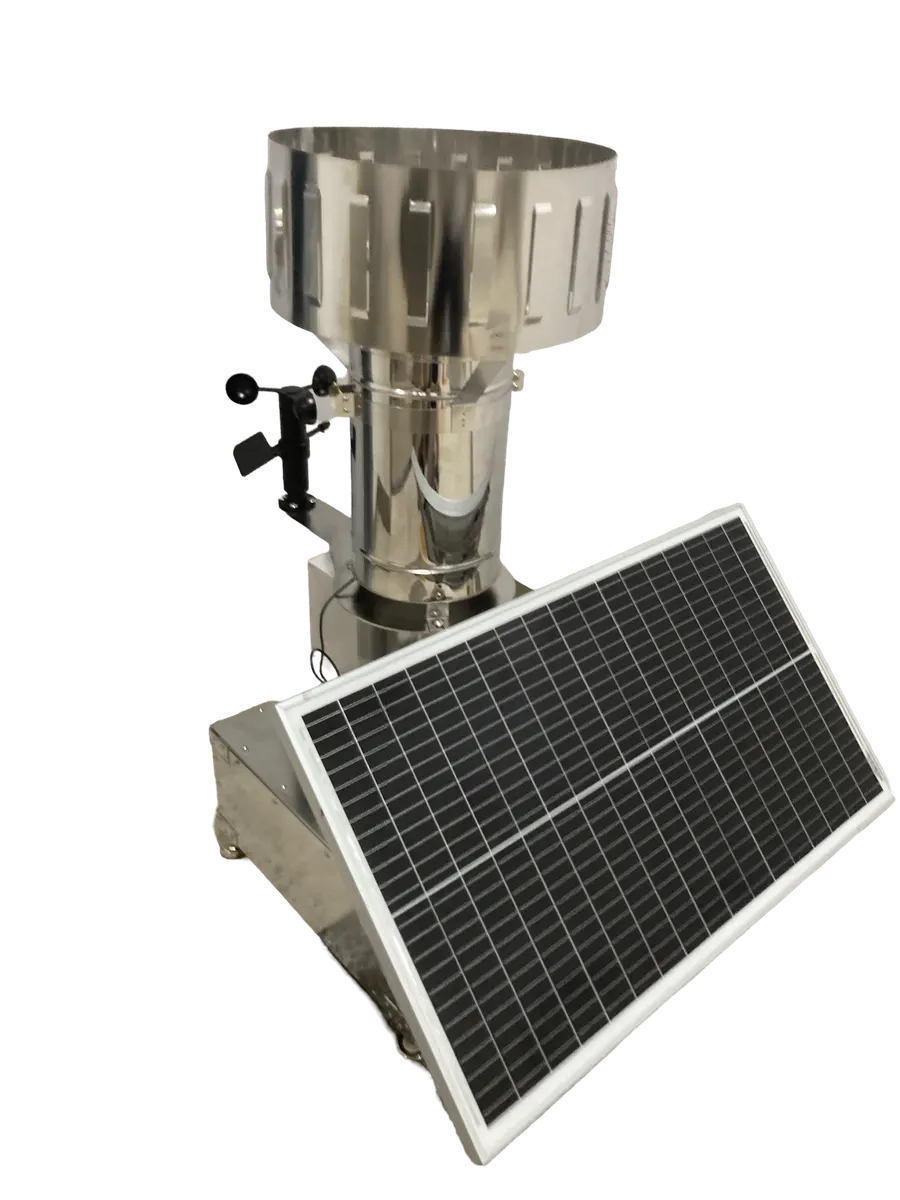
    Smart rain gauges measure rain and wind every minute.

  2. 02QC

    Data quality control

    Wind-effect correction and gap/outlier checks produce clean data.

  3. 03MODEL

    Risk analysis

    Terrain and drainage data, physics models and deep learning estimate flood risk.

  4. 04ALERT

    Monitoring & alerts

    Risk levels appear on the monitoring screen and alerts go to staff and residents.

  5. 05RESPONSE

    Response

    Closures, evacuation support and facility checks follow; outcomes feed back into the models.

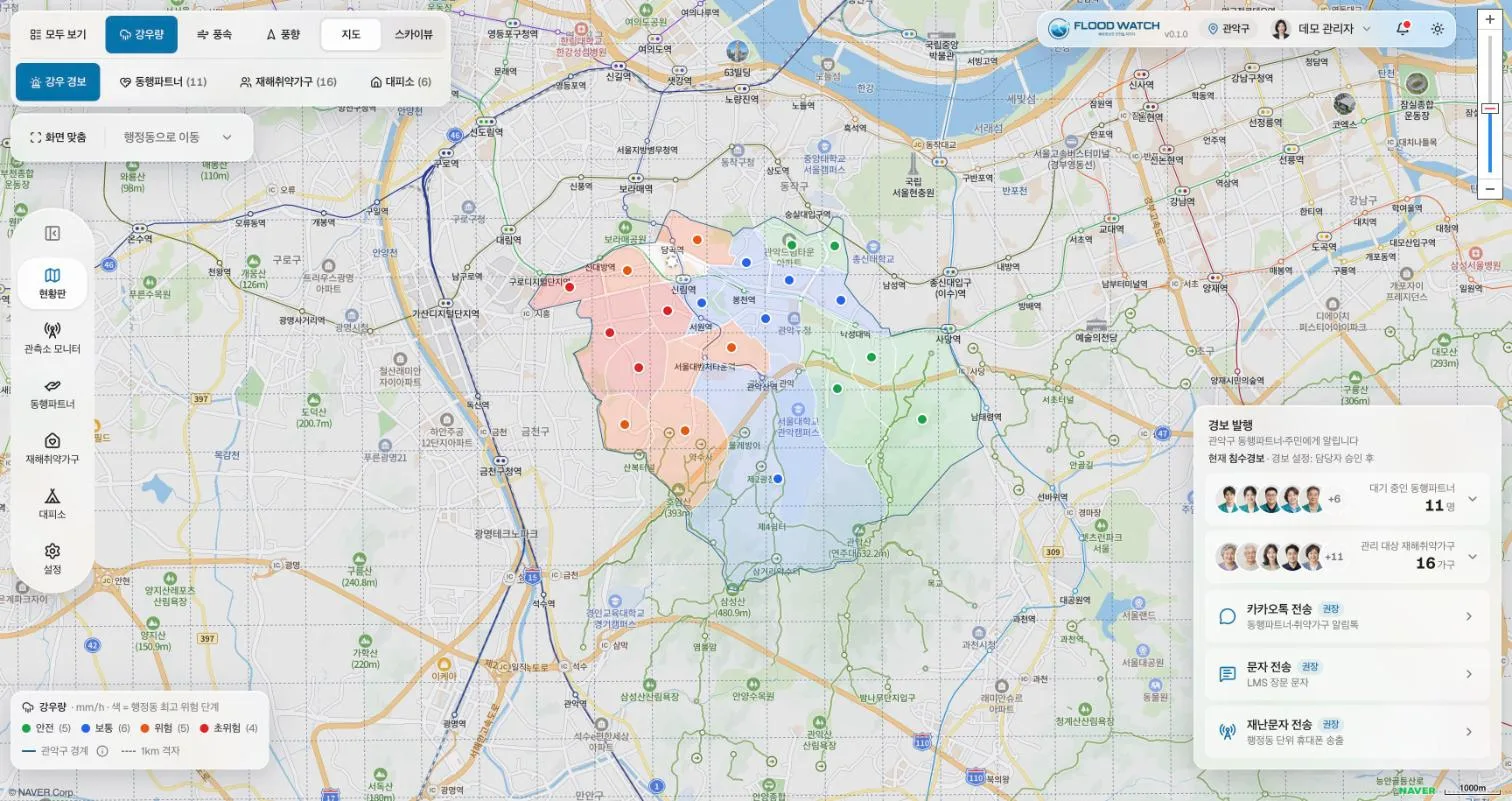
Flood Watch

The real screens.

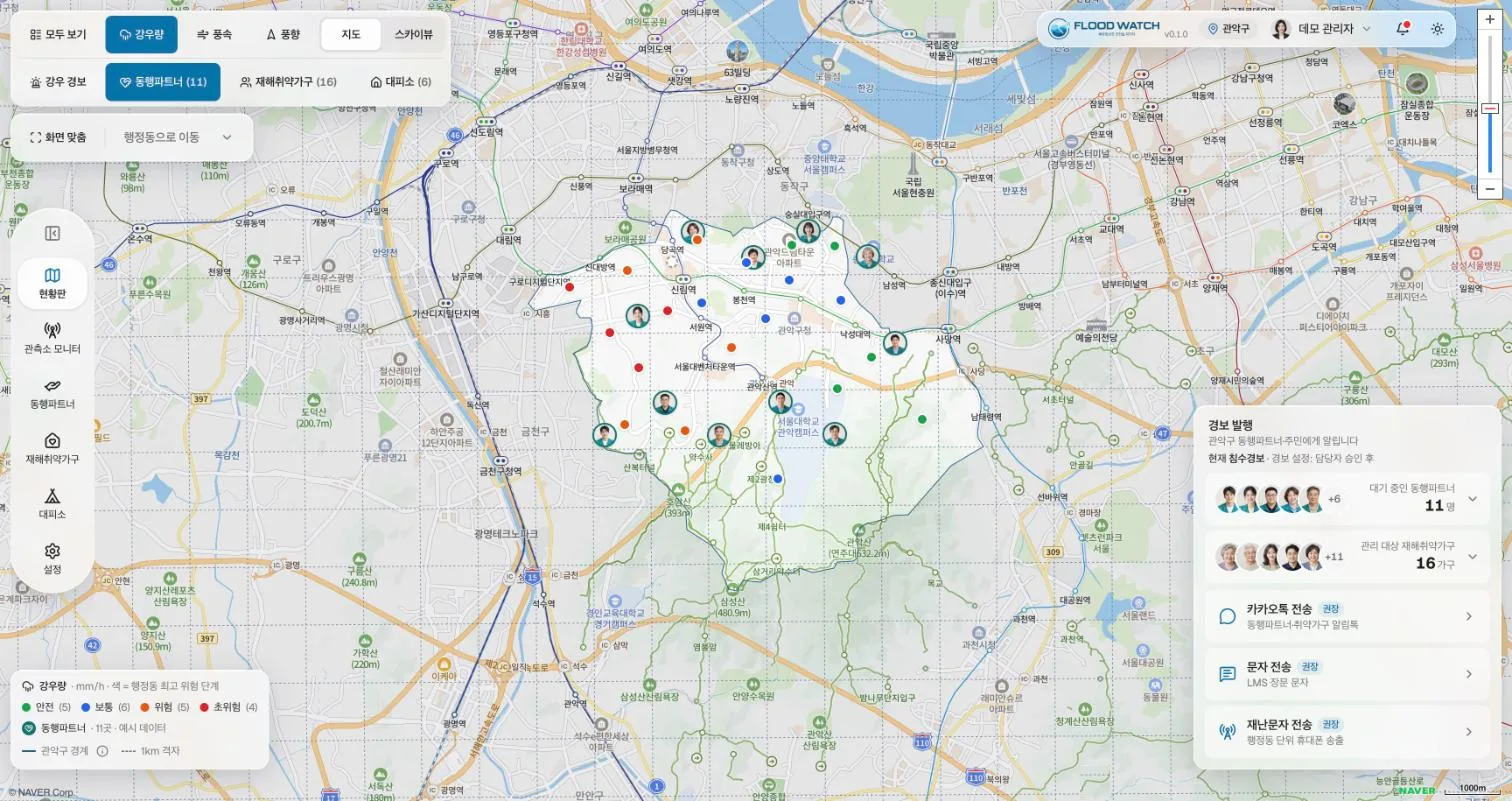
  • Risk level by neighborhood at a glance
  • From partner dispatch to evacuation complete
  • Send alerts straight from the alert panel

Learn more →

    • Risk level by neighborhood, colored on the map
    • Gauge locations and values on a 1 km grid
    • Send alerts straight from the alert panel
    • Where standby companion partners are
    • Staff closest to risk zones
    • Linked to assigned households
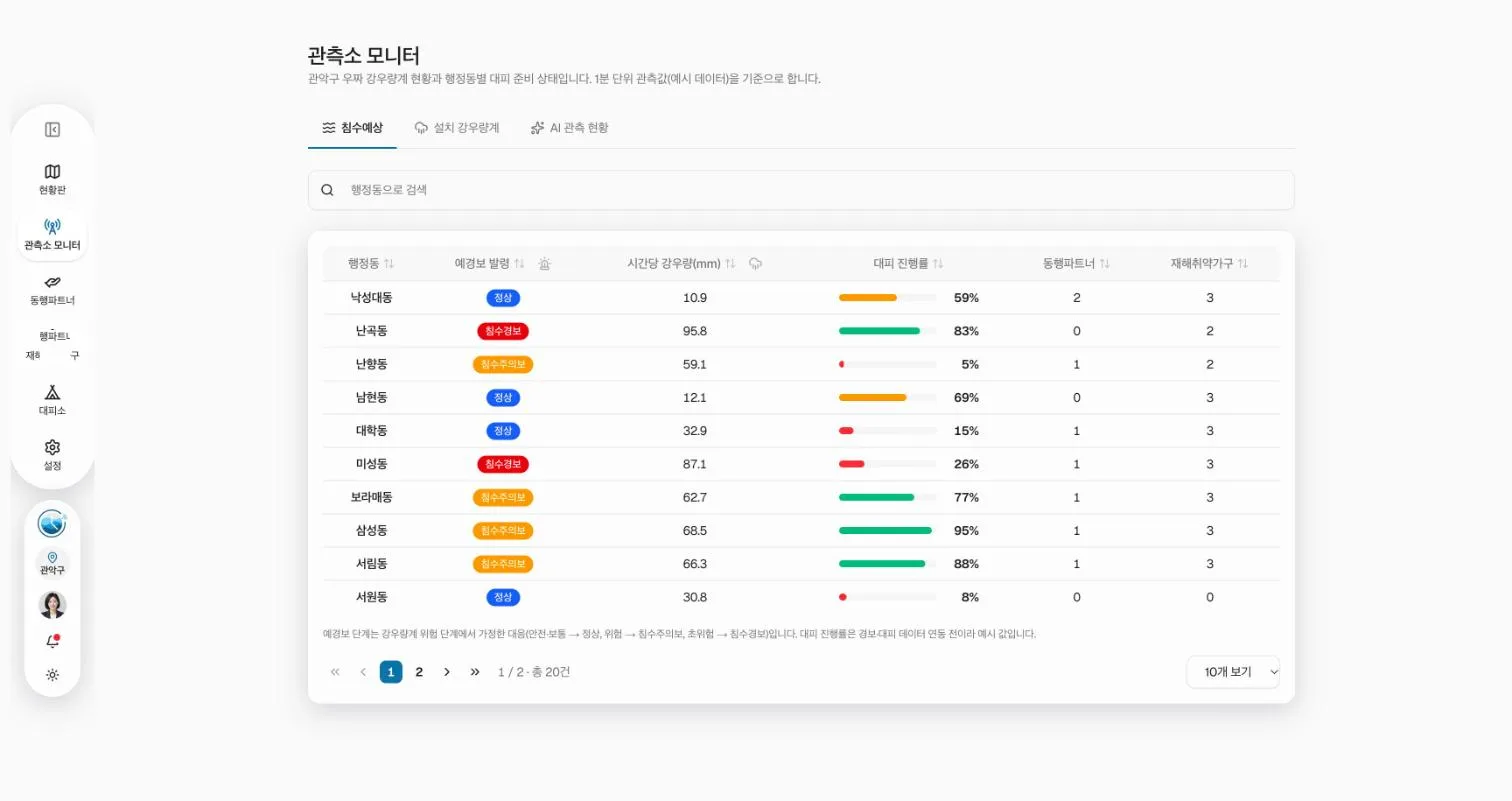
    • Advisory and warning level by neighborhood
    • Hourly rainfall
    • Evacuation progress, live
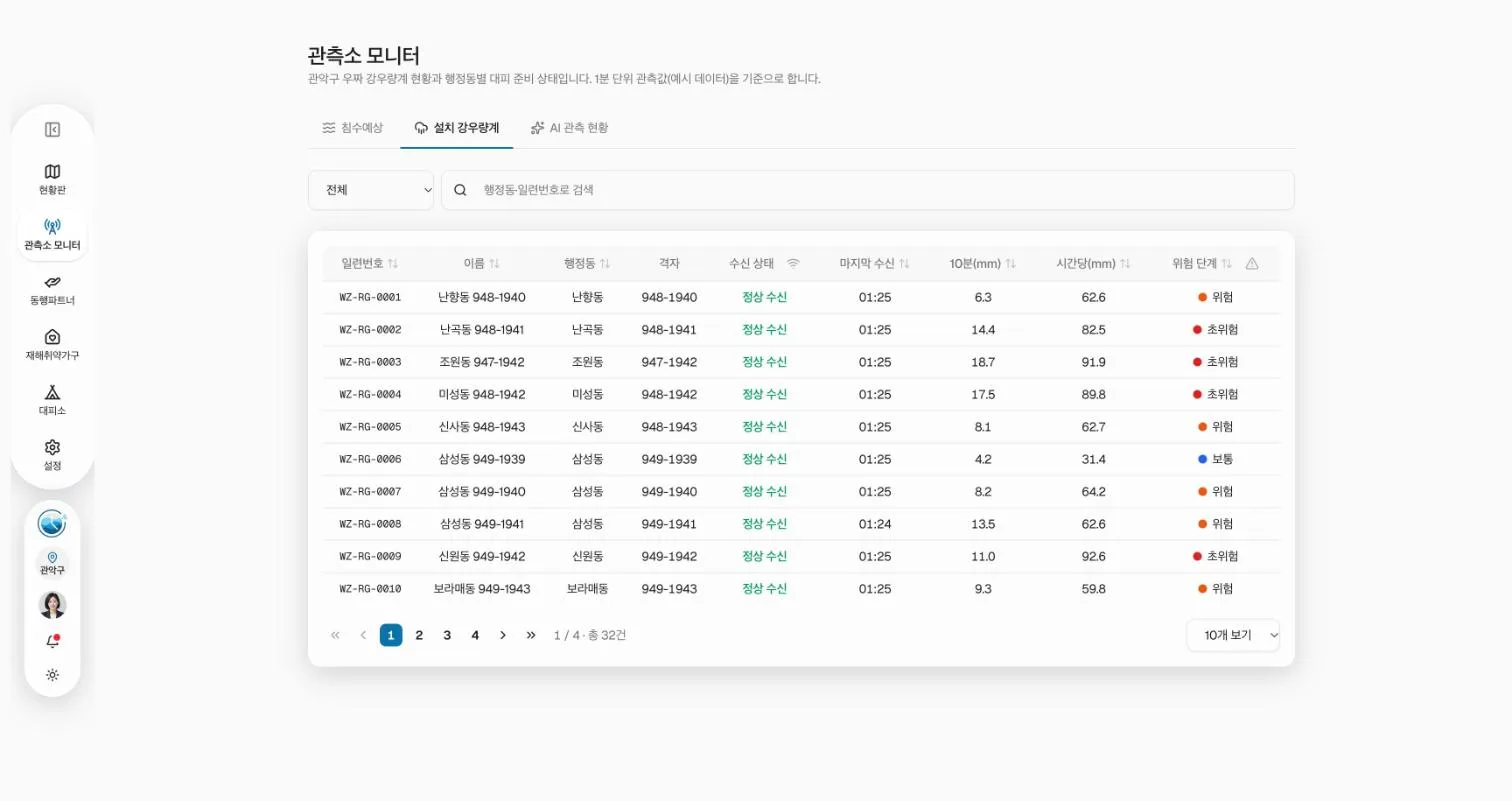
    • Link status and last reading per device
    • 10-minute and hourly rainfall
    • Risk level per device
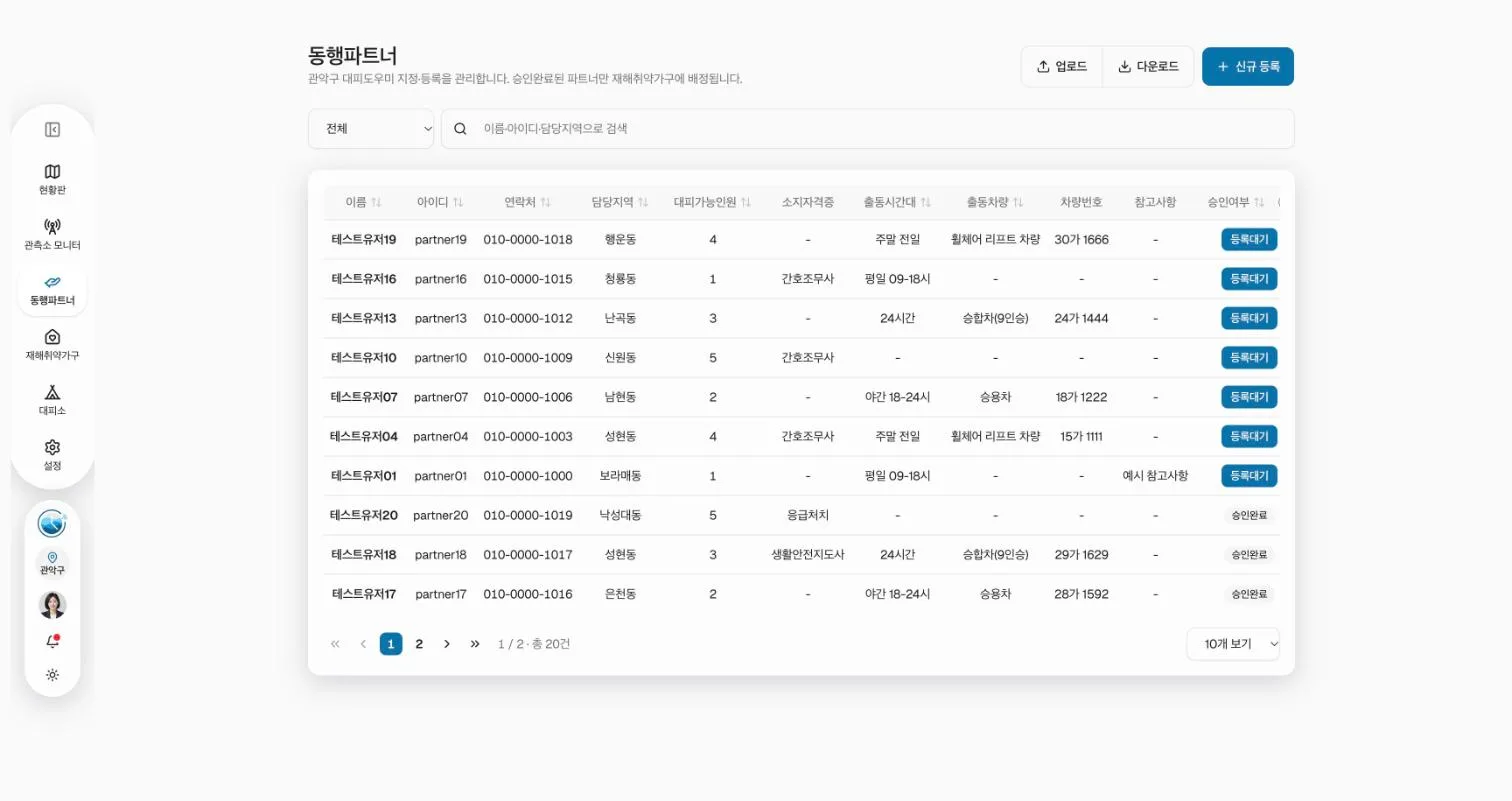
    • Area, availability and vehicle
    • Assigned to households after approval
    • Bulk upload from spreadsheets
    • Facility type and capacity
    • Assigned people and contact
    • Linked to households and partners
Flood Watch screen: Live mapFlood Watch screen: Partner positionsFlood Watch screen: Flood outlook & evacuationFlood Watch screen: Installed gaugesFlood Watch screen: Partner managementFlood Watch screen: Shelters
Flood Watch demo · sample data

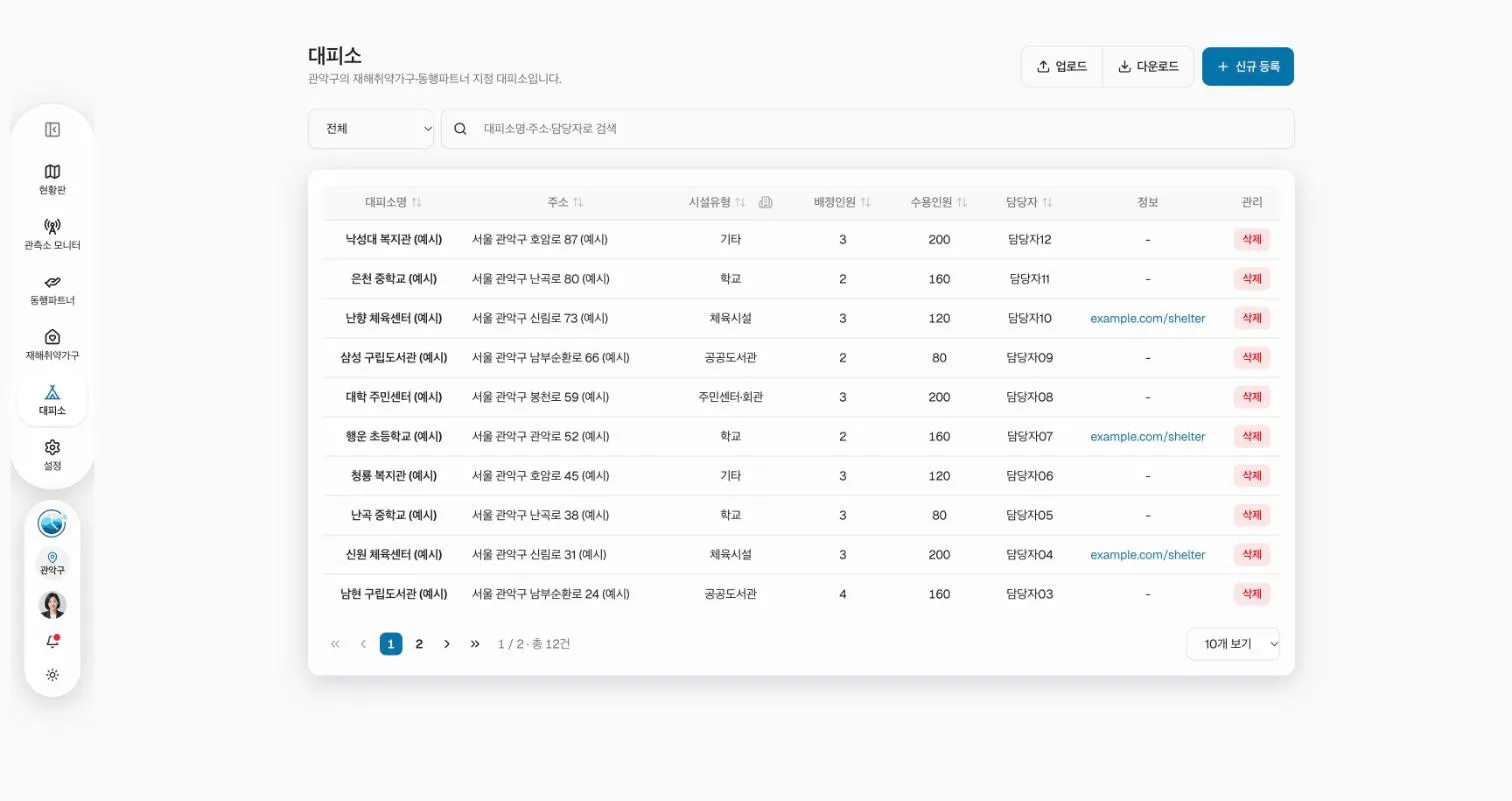
Field Rainfall Data API

Field rainfall, one API call away.

  • Neighborhood-level points, every minute
  • Raw/corrected status and quality flags
  • Webhook alerts on thresholds
cURL200 OK
curl "$WOOZZA_API/v1/observations/latest?station=WZ-RG-0002" \
  -H "Authorization: Bearer $WOOZZA_API_KEY"
{
  "station_id": "WZ-RG-0002",
  "observed_at": "2026-10-17T01:25:00+09:00",
  "rain_10min_mm": 14.4,
  "rain_1h_mm": 82.5,
  "quality": { "status": "corrected" },
  "risk_level": 4
}

06Observation network

From one city to many.

Pilots in Gwanak-gu, Seoul and Brooklyn, New York. More cities next.

Drag to rotate. Select a point, or choose a region from the list below.

Reduced motion is on or WebGL is unavailable, so a static globe and region list are shown.

Regions

Seoul, South Korea

Gwanak-gu, Seoul

Pilot running2024–

We have been running an urban flood-response pilot here since 2024. We placed observation points at the neighborhood level and connected a 6 m-grid flood scenario with Flood Watch monitoring.

A region where we install field equipment and run a pilot.
New York State, USA

Brooklyn, New York

Pilot running2025–

We have been running a deep-learning-based flood-prediction display pilot here since 2025, operating locally from device installation through real-time monitoring to flood alerts.

A region where we install field equipment and run a pilot.
USA

California

PlannedPlanned

Preparing to expand as a pilot site on the US West Coast.

A region preparing for a pilot under our global expansion roadmap.

Middle East

United Arab Emirates

PlannedPlanned

Preparing to expand as a pilot site in the Middle East.

A region preparing for a pilot under our global expansion roadmap.

Vietnam

Hanoi

PlannedPlanned

Preparing to expand as a pilot site in Southeast Asia.

A region preparing for a pilot under our global expansion roadmap.

Legend

  • Pilot running
  • Planned
  • Dotted line: expansion vision (conceptual)

Arcs and light trails illustrate an expansion vision. They do not represent real communication links or data connections.

07Applications

Wherever rain becomes a problem.

Same data, a different decision on every site.

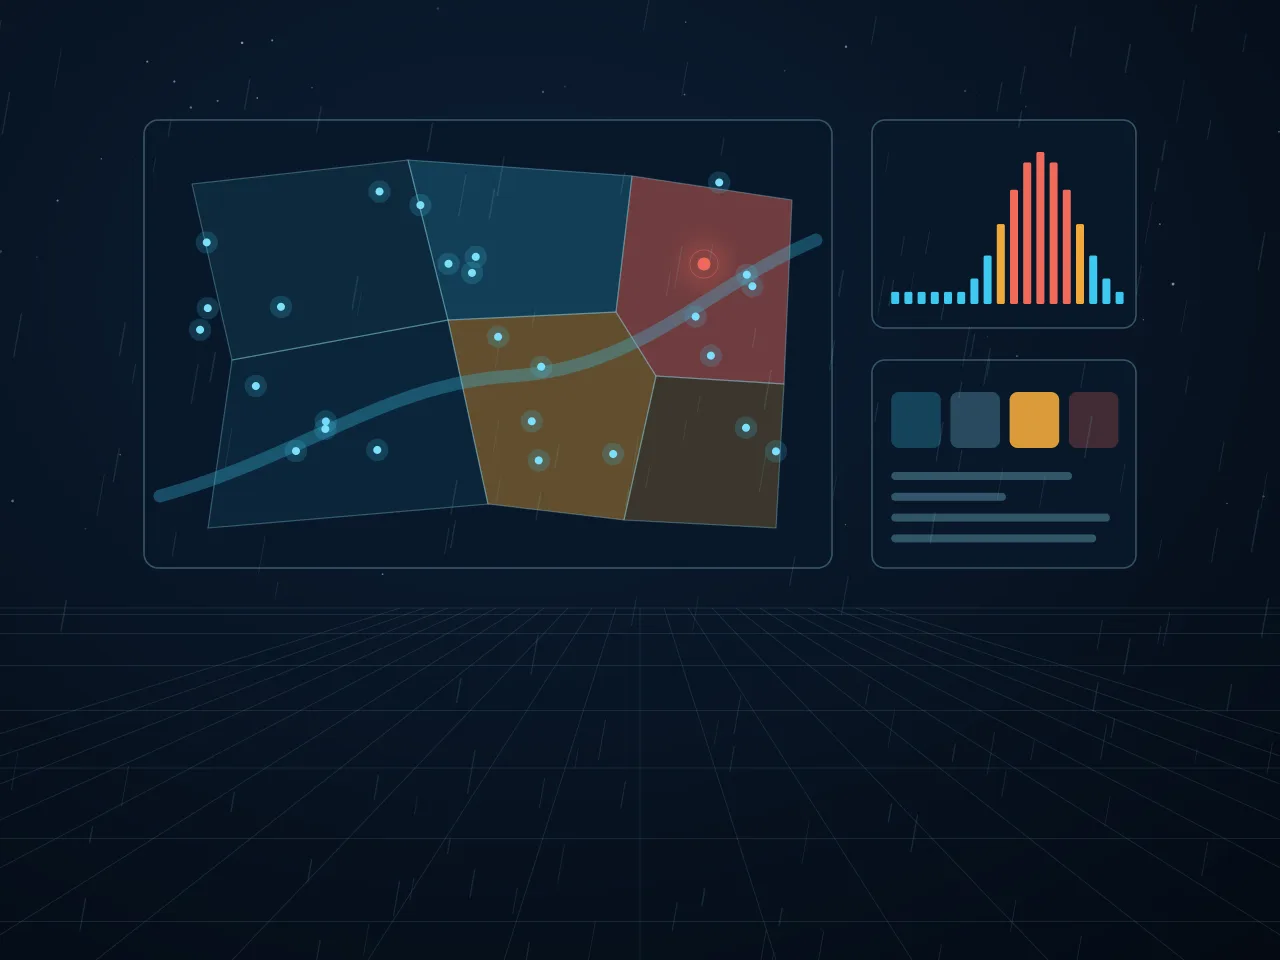
Illustration of a monitoring map: zones colored by risk, observation points and a rainfall bar chart

USERS

  • Disaster operations room
  • District flood-control/safety department
  • Neighborhood community service center

WORKFLOW

  1. 1Detection
  2. 2Judgment
  3. 3Propagation
  4. 4Action confirmation
  5. 5Post-event review
Urban flood response
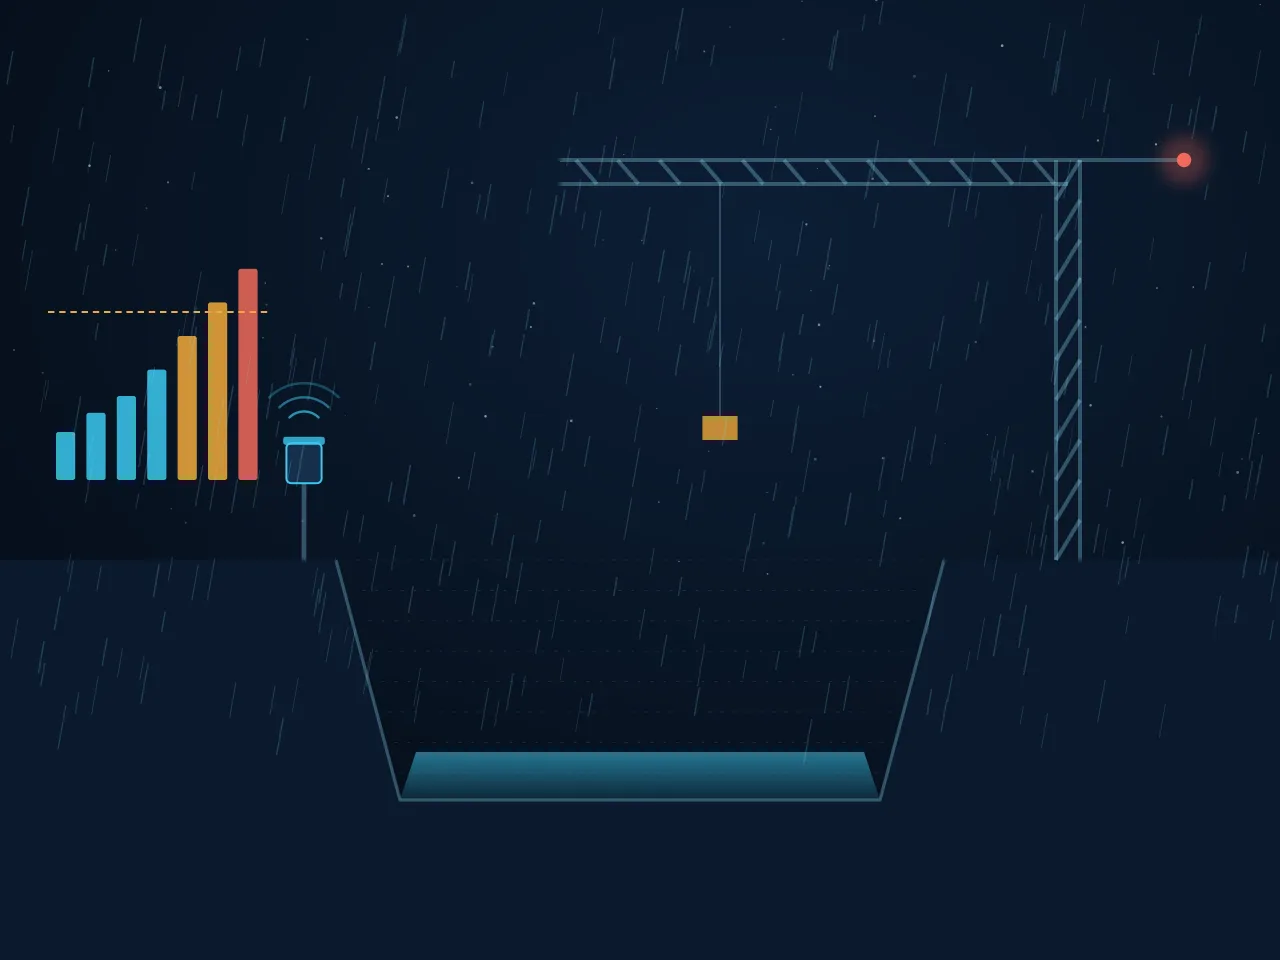
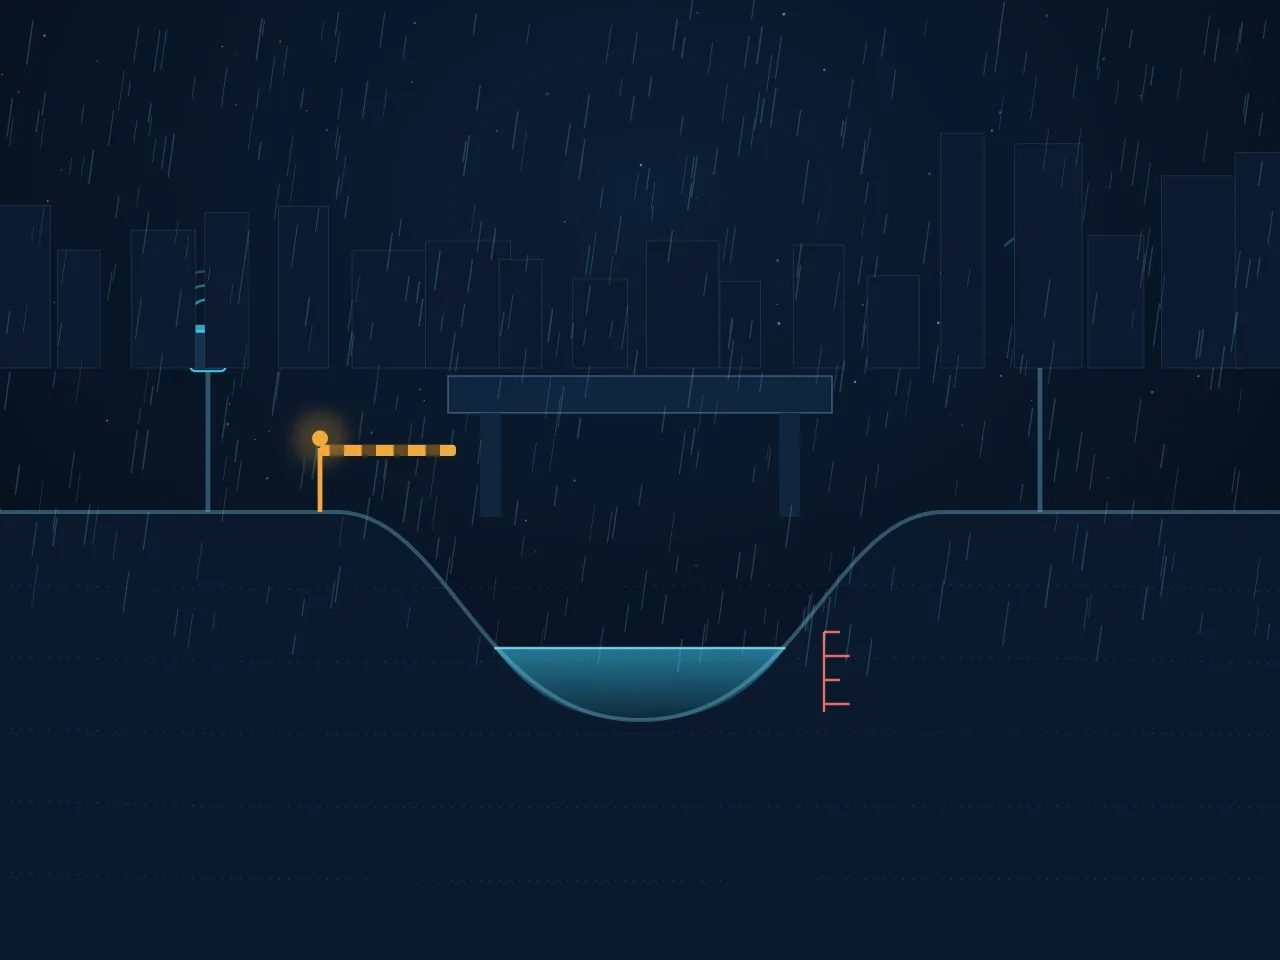
Cross-section illustration: rainwater pooling at an underpass low point while a roadside rain gauge sends data

USERS

  • Road/underpass management department
  • Traffic control
  • Field inspection staff

WORKFLOW

  1. 1Set thresholds
  2. 2Field observation
  3. 3Staged alert
  4. 4Control & guidance
Underpass & road risk management
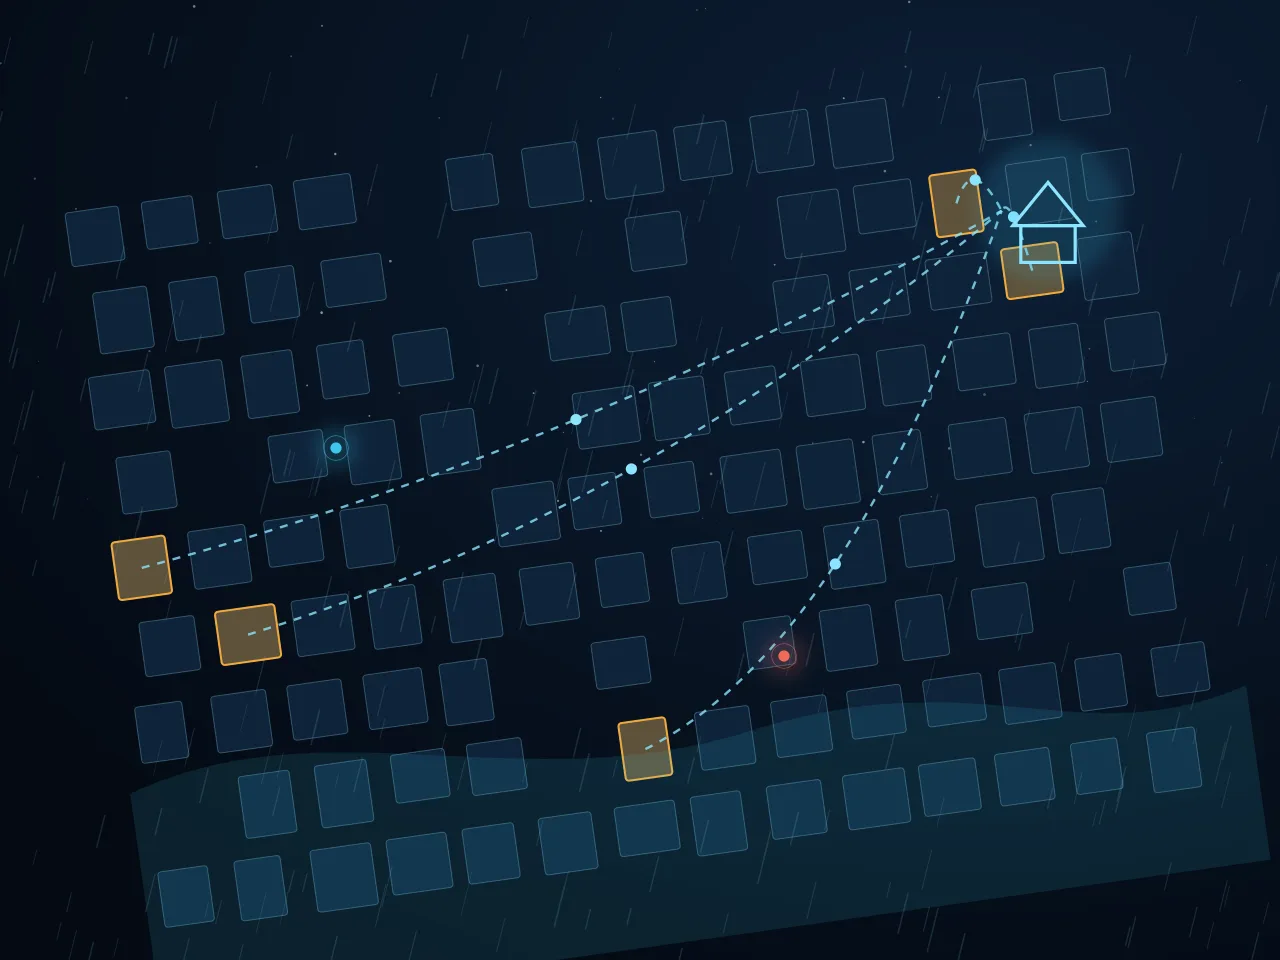
Plan-view illustration of evacuation routes linking highlighted homes to a shelter

USERS

  • Care officer
  • Evacuation support staff (companion partners)
  • People who need evacuation support

WORKFLOW

  1. 1Pre-registration
  2. 2Risk detection
  3. 3Alert & dispatch
  4. 4Evacuation in progress
  5. 5Completion tally
Tailored evacuation support
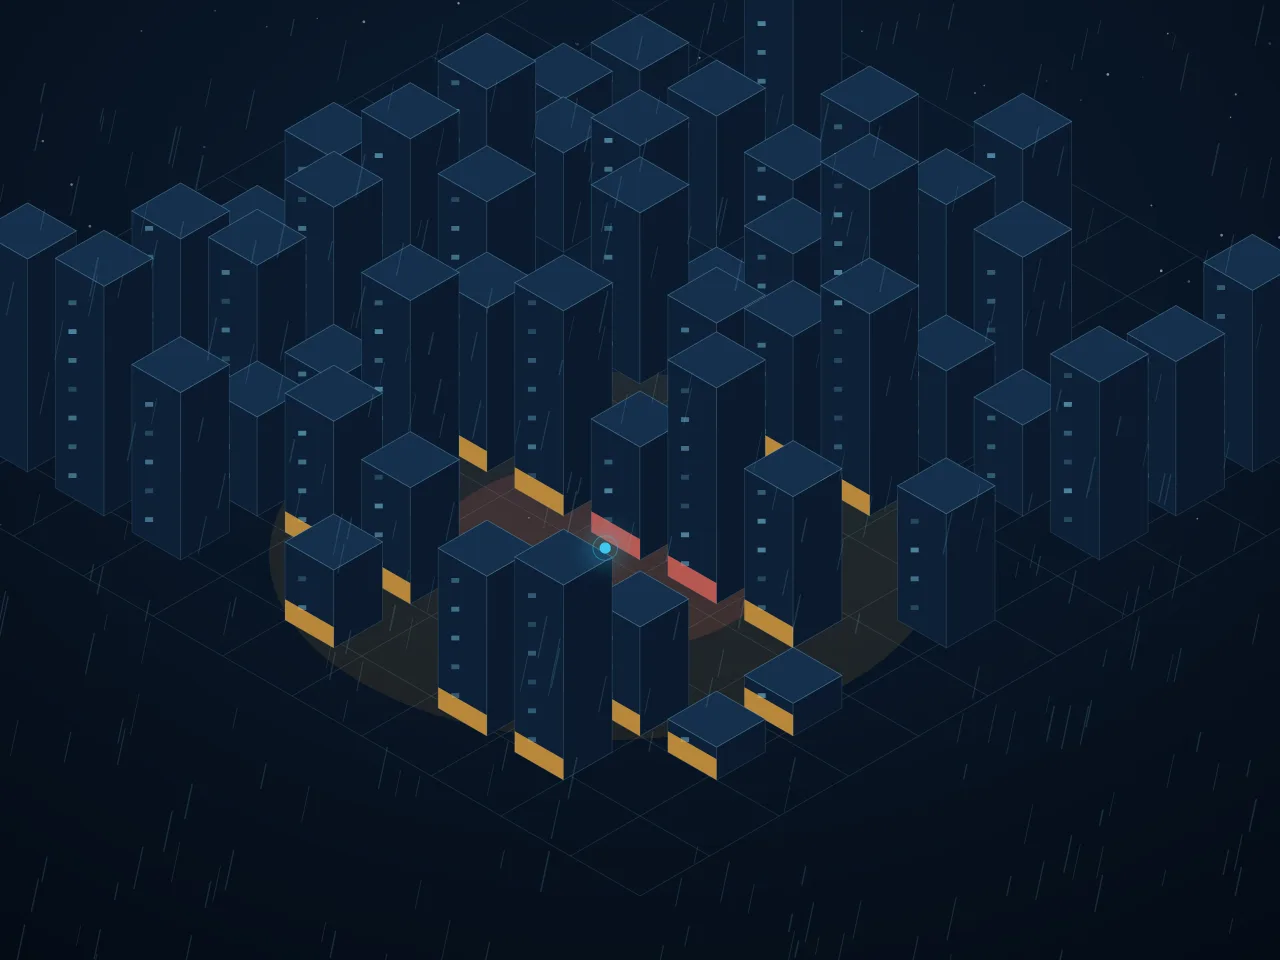
Isometric illustration of city blocks with flood-exposed ground floors highlighted

USERS

  • Insurer product/risk department
  • Claims department
  • Corporate risk-management organization

WORKFLOW

  1. 1Data integration
  2. 2Risk assessment
  3. 3Preventive alert
Insurance & risk management