
Technology · Data quality
Rainfall data that shows the status behind every reading
Summary
Field observations can be affected by installation location, wind and device condition. WOOZZA keeps raw and corrected values separate and flags gaps and anomalies, giving you the basis to interpret the data.
Why correction is needed
Rain gauges tend to under-measure rainfall as wind gets stronger, because raindrops are deflected away from the collector. This effect can be larger in places where surrounding structures, such as a building rooftop, create turbulence.
Placing observation points densely across a city makes it hard to secure the wide, flat ground a standard weather station would have. So the environmental effect that varies by installation location has to be handled at the data stage.
How wind affects rainfall measurement
Raindrops fall at an angle when the wind blows. The stronger the wind, the less rain enters the collector, so the gauge records less than actually fell.
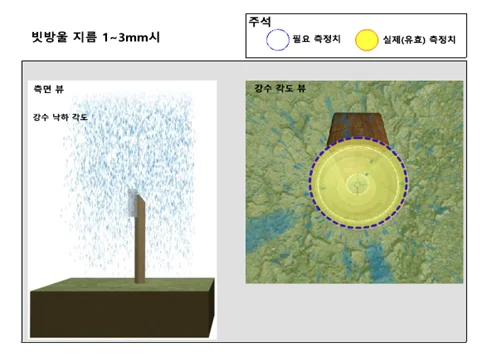
No wind: drops fall vertically and enter the collector as they are. 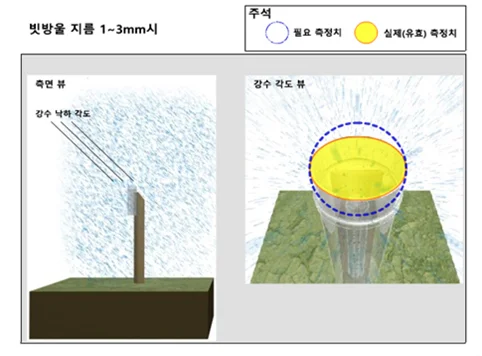
Wind: the angle of falling rain tilts, creating a gap between the required and actual measurement. 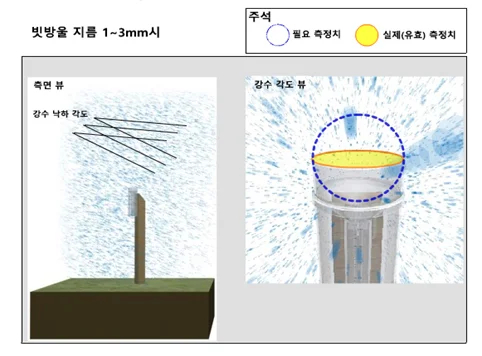
Strong wind: more rain misses the collector, so under-measurement grows.
Quality-control flow
| Stage | Input | Processing | Output |
|---|---|---|---|
| Collection | 1-minute rainfall, wind direction, wind speed, pressure, device status | Timestamp alignment, flagging communication gaps | Raw data |
| Checking | Raw data | Range checks, sudden-change detection, device-fault signal checks | Valid/invalid flags |
| Correction | Valid data + wind direction/speed | Wind-effect correction, applying installation-environment coefficients | Corrected rainfall and correction coefficients |
| Gap filling | Missing intervals | Filling based on nearby points and public data (flag retained) | Clean data flagged for whether it was filled |
Details of the correction formula and coefficient method are shared during technical discussions.
How the installation environment is reflected
Preventing debris intrusion
A cover structure that opens and closes depending on rainfall (a registered patent) is designed to reduce leaves and dust getting in.
Analyzing surrounding terrain effects
Sustained wind-speed/direction/load patterns and 3D wind-and-rain simulations are used to review the effect of the installation location.
Remote status management
Device and communication status are checked remotely to quickly identify observation gaps.
Why the installation site matters
The same rain can be recorded differently depending on where a gauge stands. This is why we choose sites carefully.
Measurement accuracy
Obstacles such as trees and buildings block rain or distort its flow. Sites less exposed to wind give values closer to reality.
Fine-grained local coverage
In cities where rainfall varies sharply over short distances, gauges spread across many sites let you spot risk zones quickly.
Flood prediction and evacuation decisions
Accurate values from well-placed gauges underpin flood risk analysis and bring forward preventive action such as evacuation support.
Drainage checks
Analyzing rainfall patterns by location helps identify in advance where drainage may become overloaded.
Tools for analyzing the installation environment
Before installation, we review each site’s climate, terrain and urban context with data.
Climate analysis · Ladybug
Visualizes climate conditions from EPW weather data and analyzes sunlight, wind and radiant heat to support data-driven design.
GIS analysis · Meerkat GIS
Supports professional GIS formats such as Shapefile (SHP) and links geometry with attribute data such as population and land value for deeper urban analysis.
3D city modelling · Elk
Imports roads and buildings from OpenStreetMap (OSM) and generates 3D contours from SRTM terrain data to automate city context modelling.
Why we follow WMO observation guidance
Accuracy and consistency
Designing and installing to internationally validated guidance gives data that can be compared across sites and over time.
Data compatibility
Observations made to the standard are easier to analyze alongside data from public networks and research institutions.
Reliable early warning
Gauges must measure steadily even in extreme rain to reduce false alarms and missed warnings.
Long-term operation
A durable design and a defined inspection cycle reduce long-term observation gaps and maintenance costs.
Verified scope and limits
- Correction performance is continuously validated through environment-specific testing and pilot operating data.
- Strong gusts during heavy rain, device contamination and icing may not be fully resolved by correction alone, and are flagged separately in the quality status.
- Filled values are not measured values, so they are always distinguished in analysis and records.
Read the Rain. Protect What Matters.