
6 m
Flood-analysis grid resolution
Products · Analytics
Summary
Combines field rainfall with terrain and drainage data to estimate flood risk by zone. The results are delivered to the Flood Watch monitoring screen, where staff can check them.
Integrates GIS data such as DEM, river networks, drainage pipes and building heights.
Feeds in quality-controlled one-minute rainfall and public observation data.
Calculates expected flood depth and risk level by zone, aiming to look up to three hours ahead.
Shows risk levels on the map and notifies staff when alert thresholds are reached.
Compares against actual outcomes to analyze error and retrain the model.
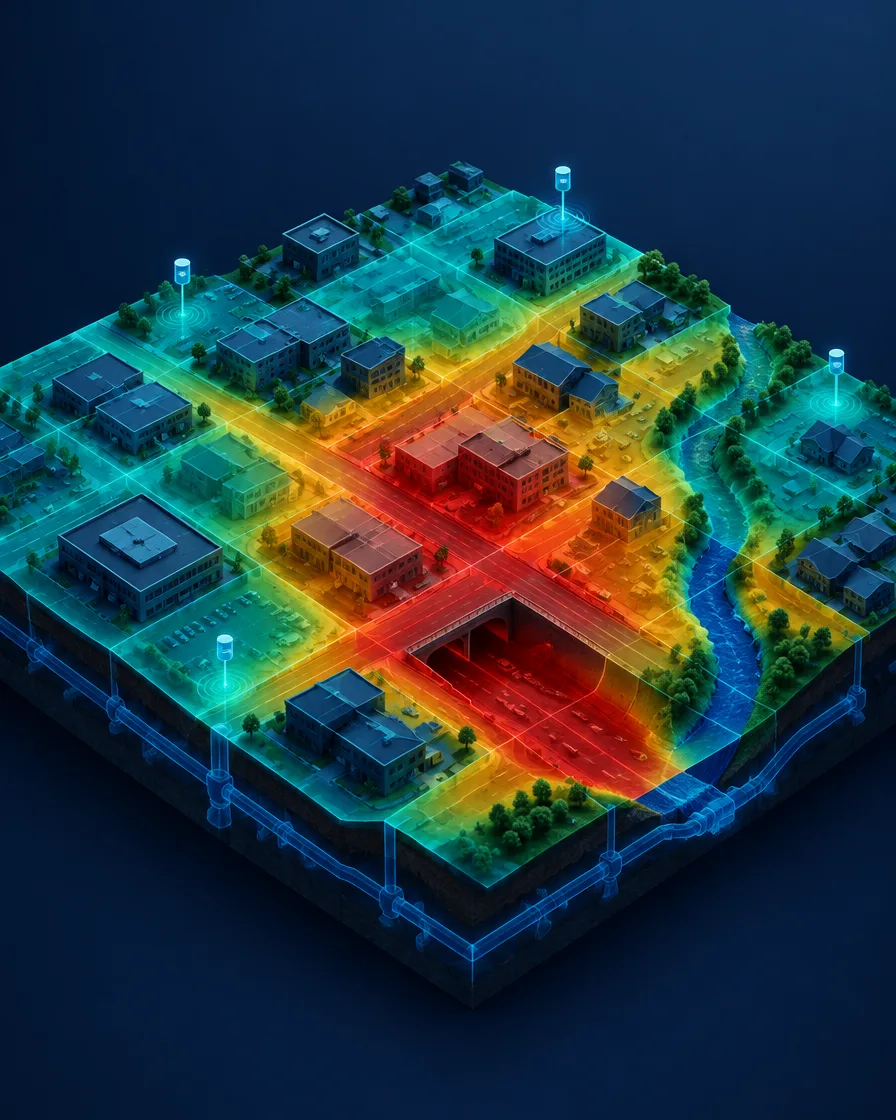
SWMM analyzes sewer-network flow, and a two-dimensional flood-analysis model builds flood maps by rainfall frequency and duration. This makes the physical basis of results easy to explain.
LSTM, CNN-LSTM and Attention architectures were reviewed, and CRU-Net — a U-Net-based structure with Attention and Residual Blocks added — is applied to quickly estimate spatiotemporal data.
The values below describe the conditions under which the model was built, not performance figures.
6 m
Flood-analysis grid resolution
1,322 × 1,097
Gwanak-gu flood-grid size
10–180 min · 5–250 mm
Rainfall scenario range (duration · total rainfall)
76 / 1,296
Number of maximum-flood-depth maps / time-series flood maps
Read the Rain. Protect What Matters.