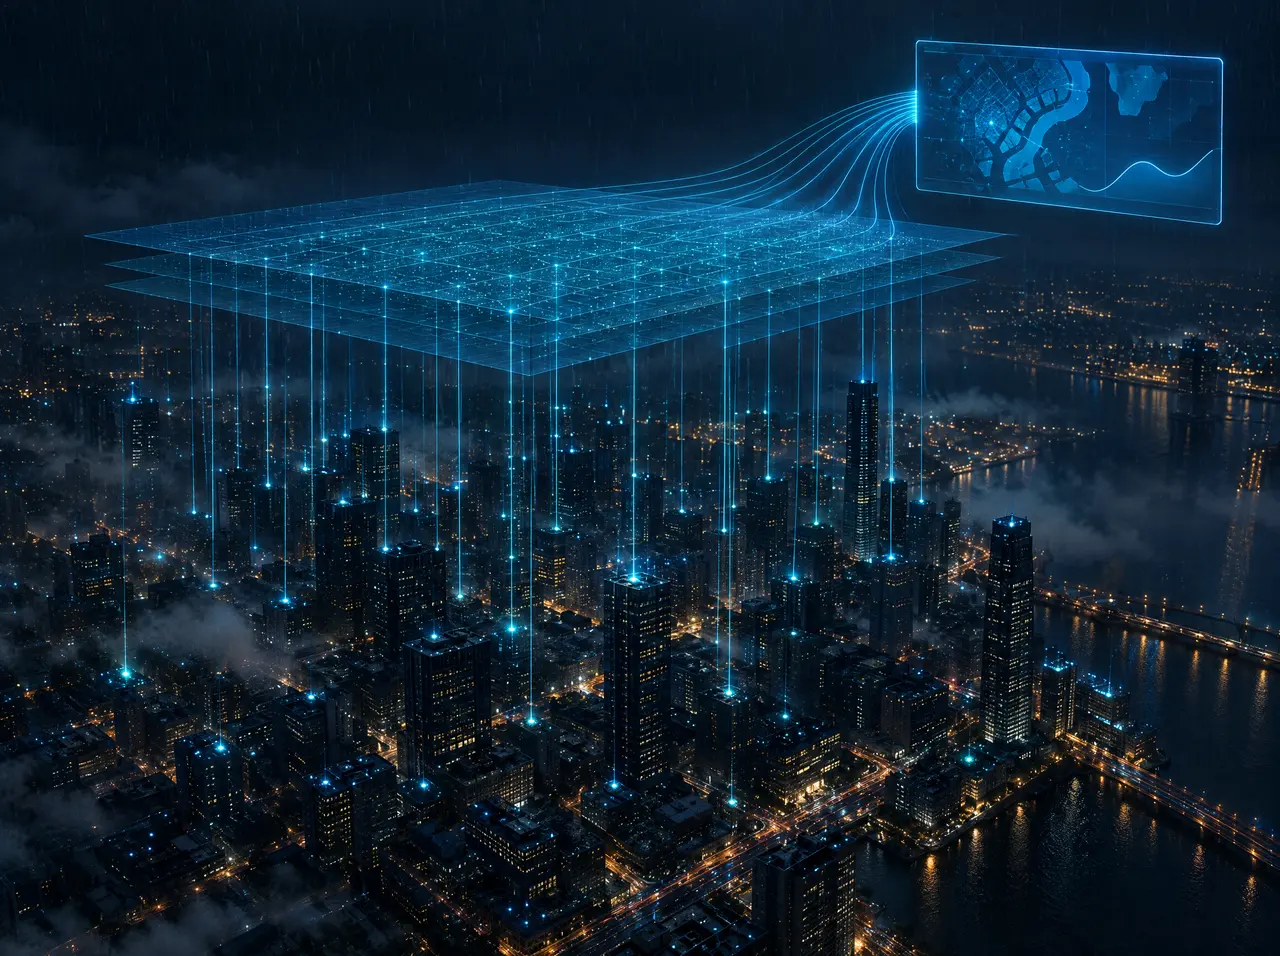
01Urban rainfall intelligence

Read the Rain. Protect What Matters.

更密集地讀懂城市的雨,加快淹水應對腳步。

WOOZZA將現場降雨觀測、風險分析、監控與通報串連為一體,協助地方政府與設施管理者確認各地點風險,並決定應採取的措施。

  • Seoul Metropolitan Government公共與防災
  • Gwanak-gu公共與防災
  • Songpa-gu公共與防災
  • Seodaemun-gu公共與防災
  • Busan Metropolitan City公共與防災
  • Korea Meteorological Administration公共與防災
  • National Fire Agency公共與防災
  • Korean National Police Agency公共與防災
  • Korea Expressway Corporation公共與防災
  • K-water公共與防災
  • Korea Hydro & Nuclear Power能源與基礎設施
  • KEPCO能源與基礎設施
  • Korea Southern Power能源與基礎設施
  • Korea East-West Power能源與基礎設施
  • KOMIPO能源與基礎設施
  • KEPCO KDN能源與基礎設施
  • Korea Institute of Civil Engineering and Building Technology研究機構
  • Brooklyn Chamber of Commerce海外機構
  • NASA海外機構
  • State of New Jersey海外機構
  • NYC Economic Development Corporation海外機構
  • NYC Department of Environmental Protection海外機構
  • Texas Economic Development Council海外機構
  • Texas Economic Development Corporation海外機構

Working with public agencies, energy, research and global partners

02問題定義

同一座城市,不同的雨。

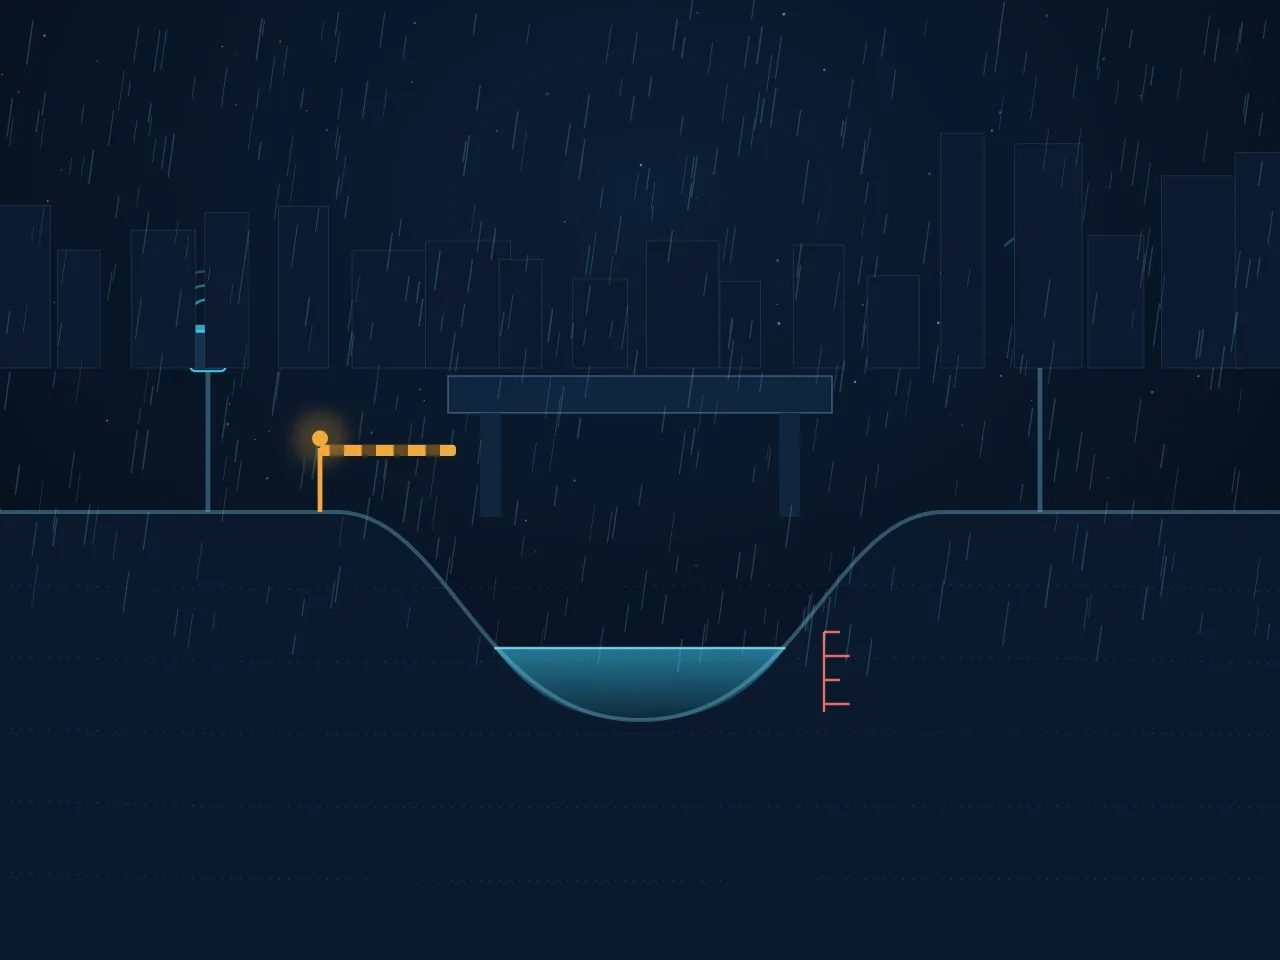
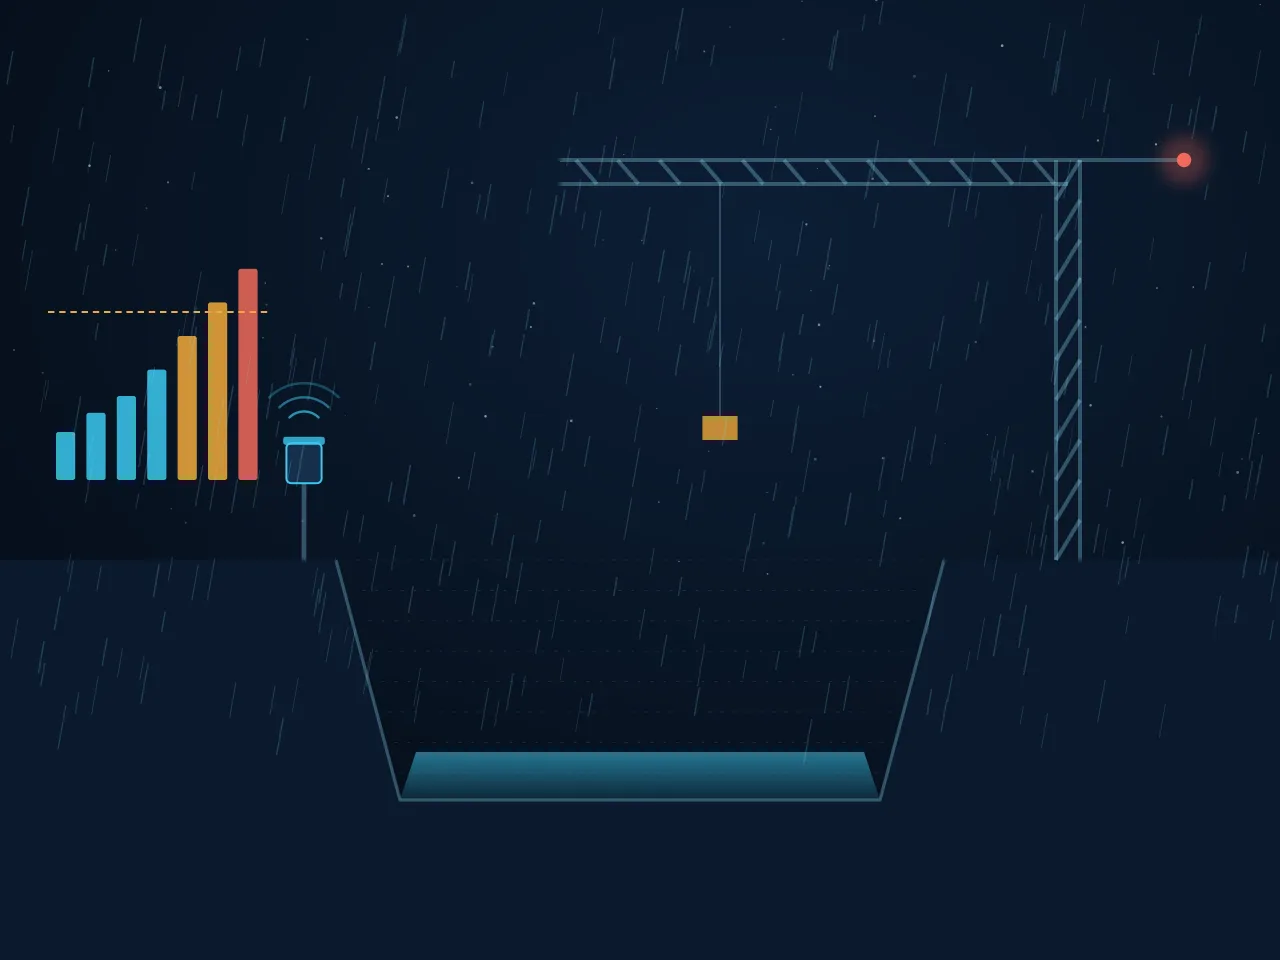
局部豪雨的強度即使在數公里範圍內也可能大不相同。地下道、半地下住宅、低窪道路等積水地點的風險,取決於該地點的降雨,而非全市平均值。

  • 01

    觀測間隔

    現場降雨往往仰賴觀測站之間距離所推估的數值,巷弄與地下道等級的差異容易被平均值掩蓋。

  • 02

    判斷時間

    從降雨達到危險程度,到承辦人員與居民得知這項事實,需要經過多層確認與通報。

  • 03

    應變連結

    即使有觀測值,若未能連結到誰、在哪裡、該做什麼,現場行動就會延遲。

03City scale

放大之後,就能看見巷弄裡的雨。

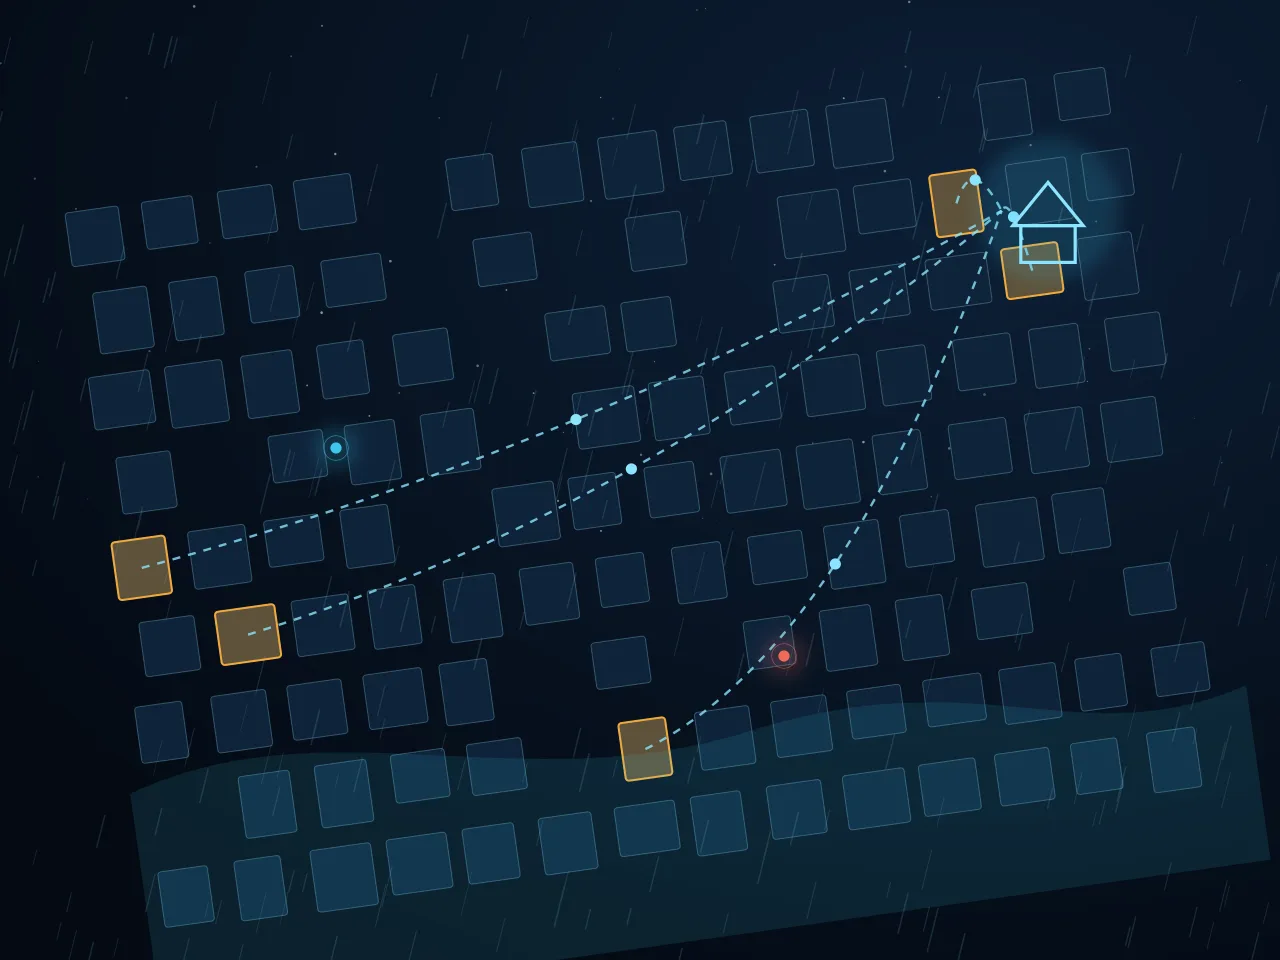
01 / 04 · 2D · Side

Estimate from the sky, or measure on the ground

  • Weather radar: estimates rain from drops aloft
  • Can differ from ground rainfall with height and wind
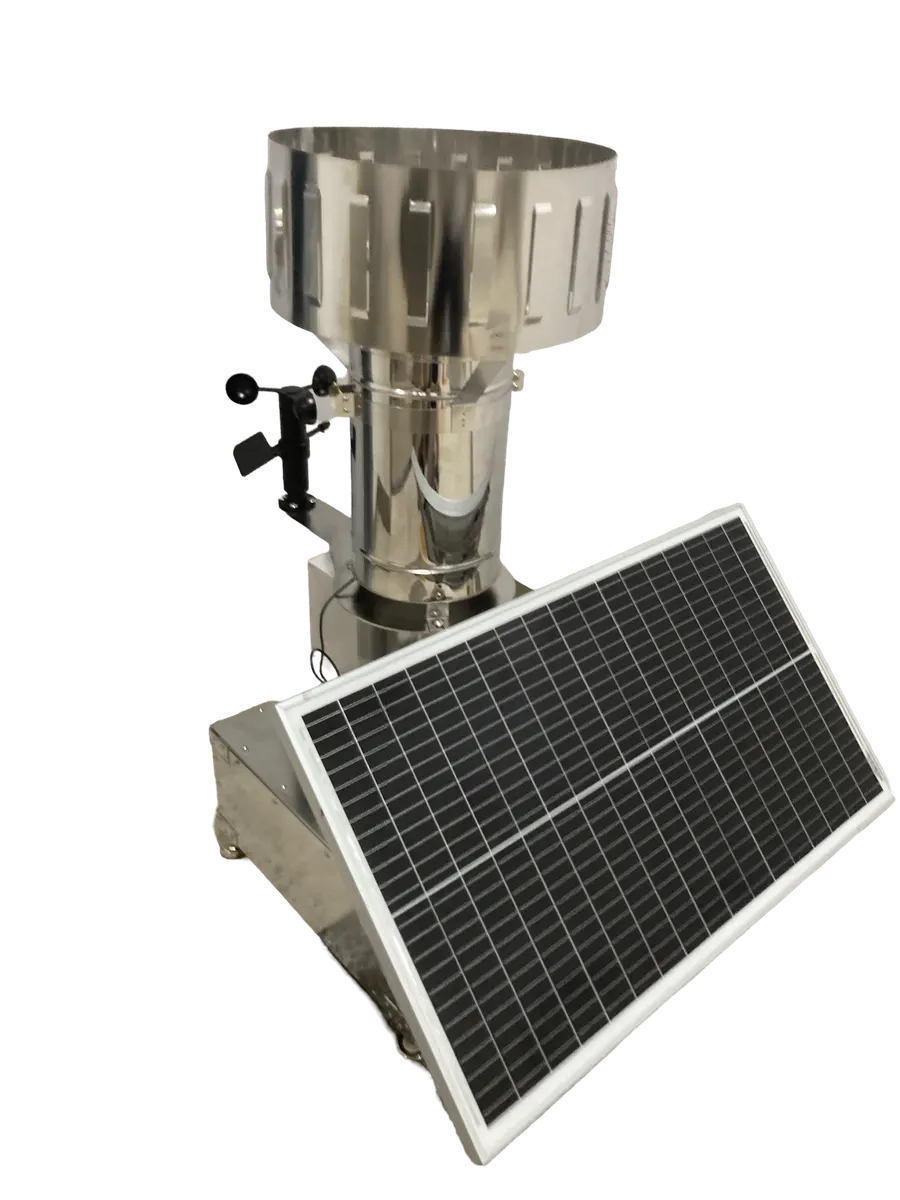
  • Ground rain gauge: measures the rain that lands

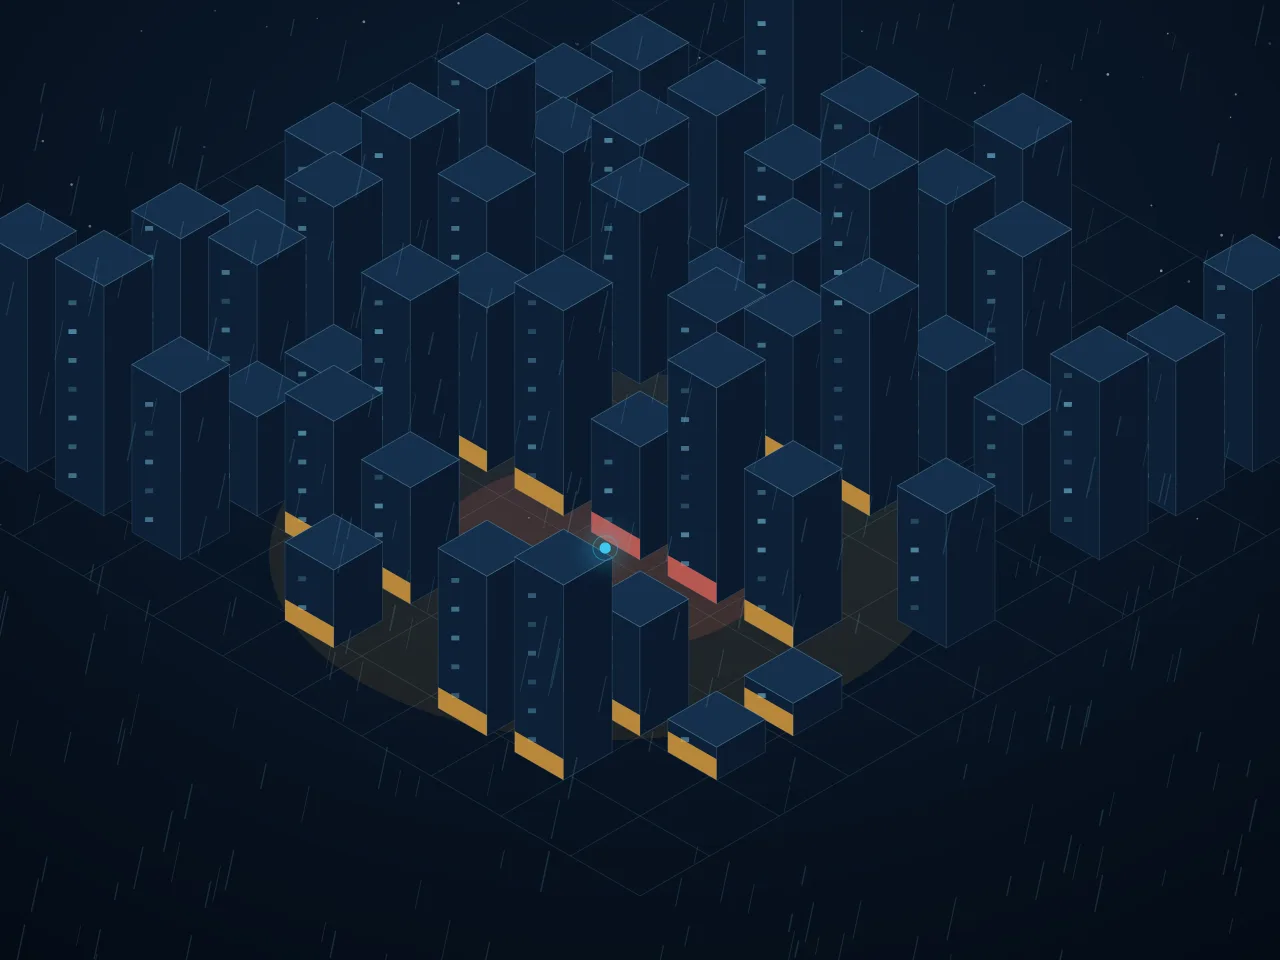
02 / 04 · 3D · Today

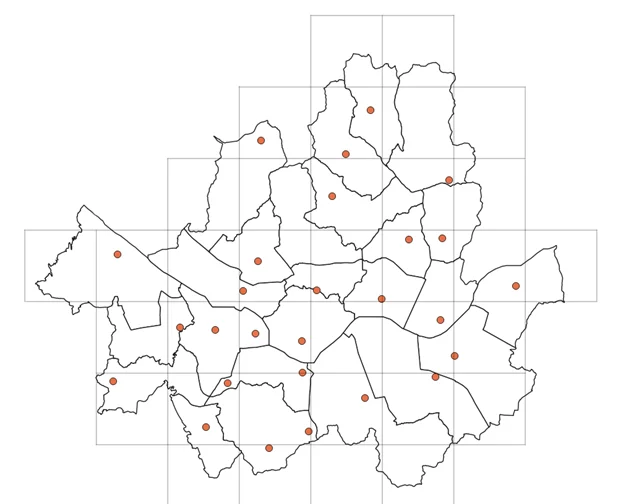
Today’s network: district by district

  • Seoul public network ≈ one per district
  • About one station per district
  • Alley- and underpass-level differences vanish in averages

03 / 04 · 3D · WOOZZA

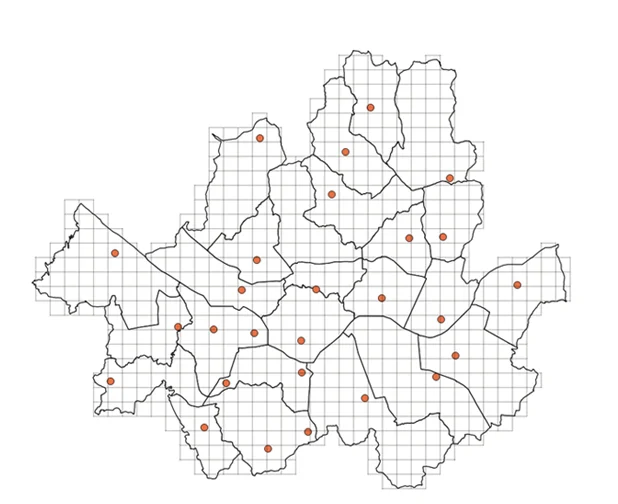
WOOZZA network: neighborhood by neighborhood

  • Gauges placed at neighborhood level
  • 1-minute rainfall at every point
  • Point-by-point differences within one storm

04 / 04 · 2D · Top

From above: 12 km → 1 km

  • Public network grid ≈ 12 km
  • WOOZZA network grid 1 km
  • Rainfall data fitted to each site

04WOOZZA Platform

從觀測到應對,一體貫通。

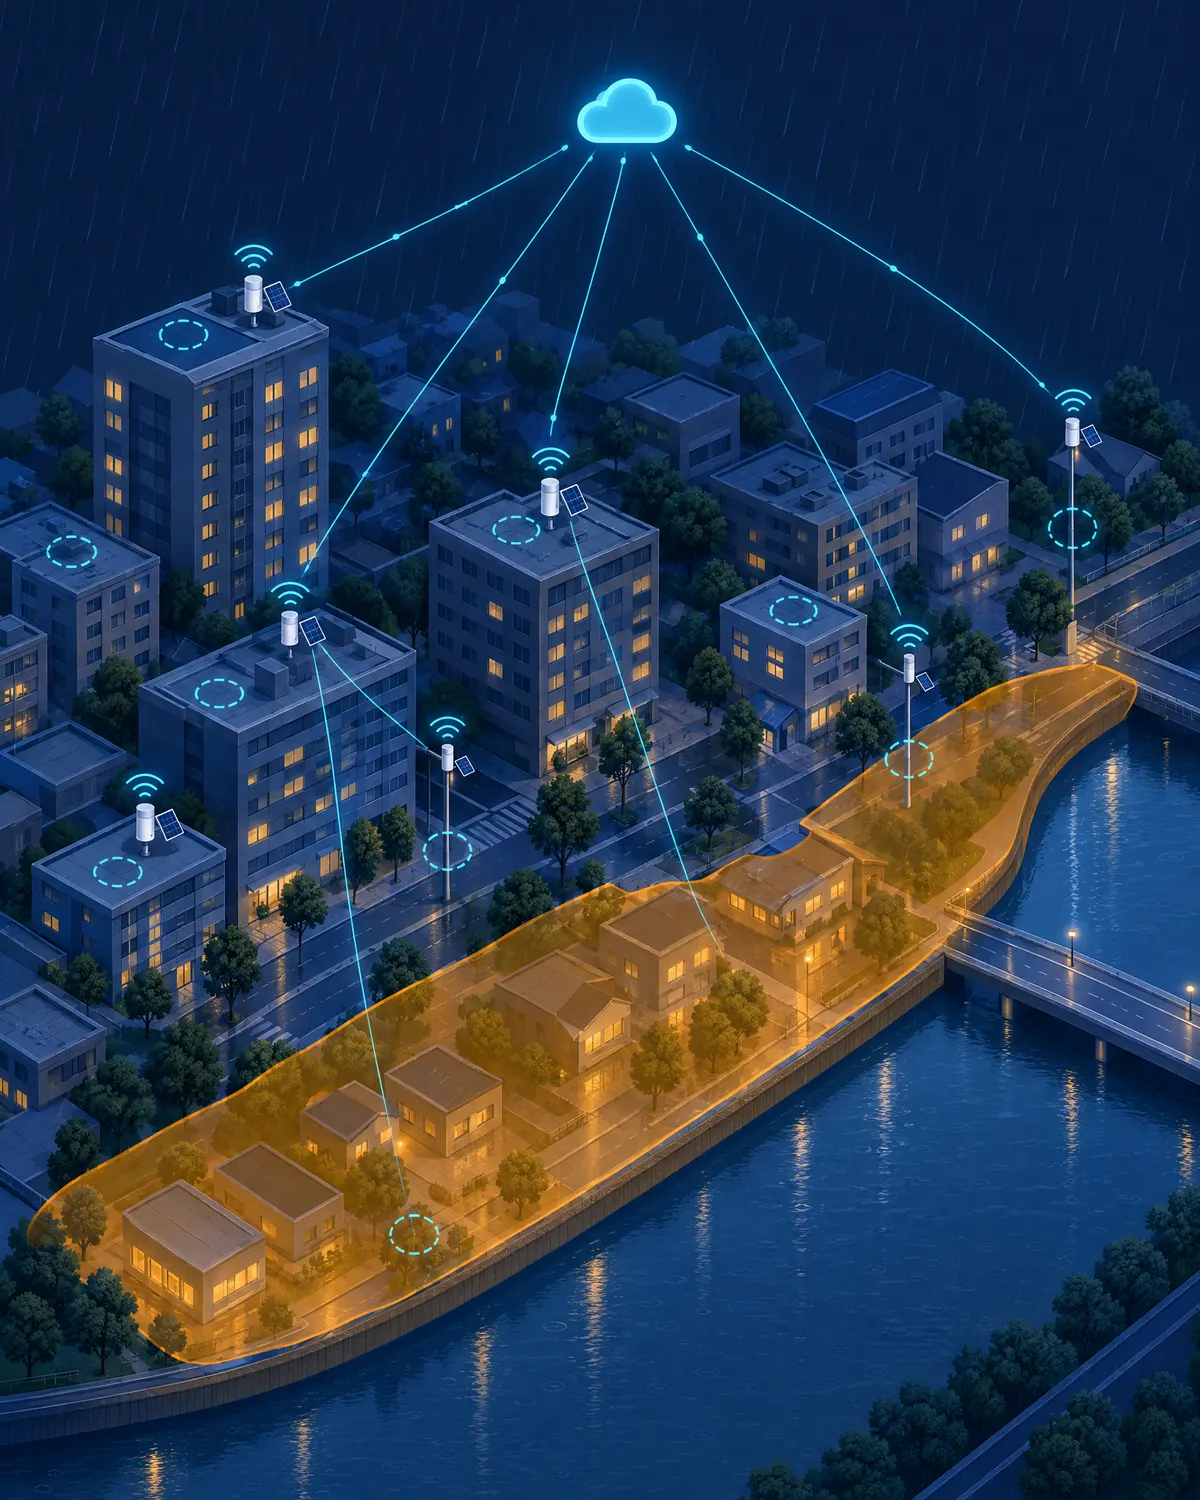
不將裝置、資料、分析、監控分開導入,而是設計成現場觀測值經過品質管理與風險分析後,直接連結到通報與應對措施。

查看運作方式 →

  1. 01INGEST

    現場觀測

    智慧雨量計每分鐘測量降雨與風。

  2. 02QC

    資料品質控管

    透過風向風速影響校正,以及缺測與異常值檢查,產出淨化後的資料。

  3. 03MODEL

    風險分析

    結合地形排水資訊與物理模型、深度學習分析,推估淹水風險。

  4. 04ALERT

    監控與通報

    在監控畫面顯示風險等級,並向承辦人員與對象發送通報。

  5. 05RESPONSE

    應變

    接續管制、疏散協助、設施檢查等現場措施,結果再回饋至模型學習。

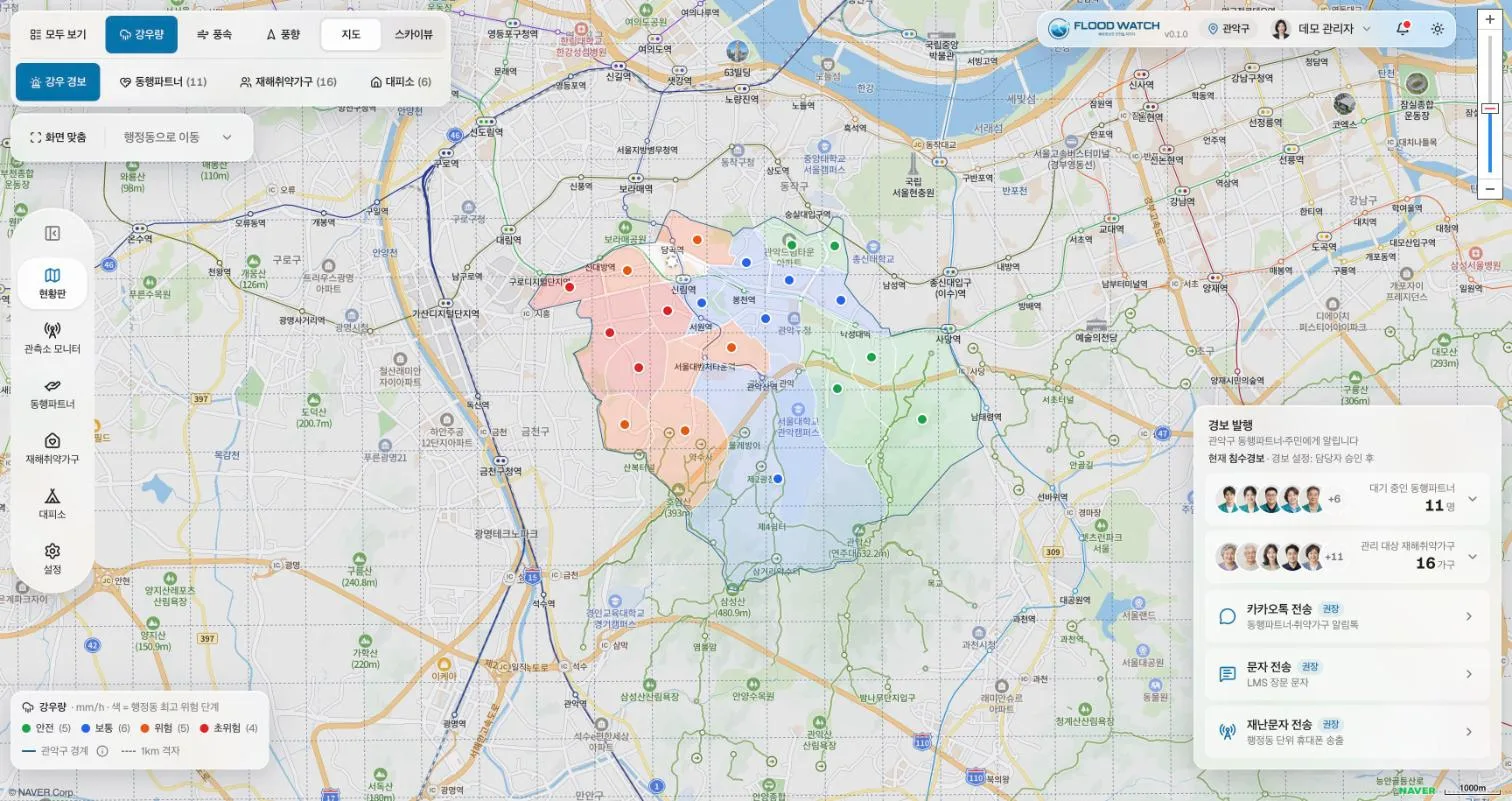
Flood Watch

The real screens.

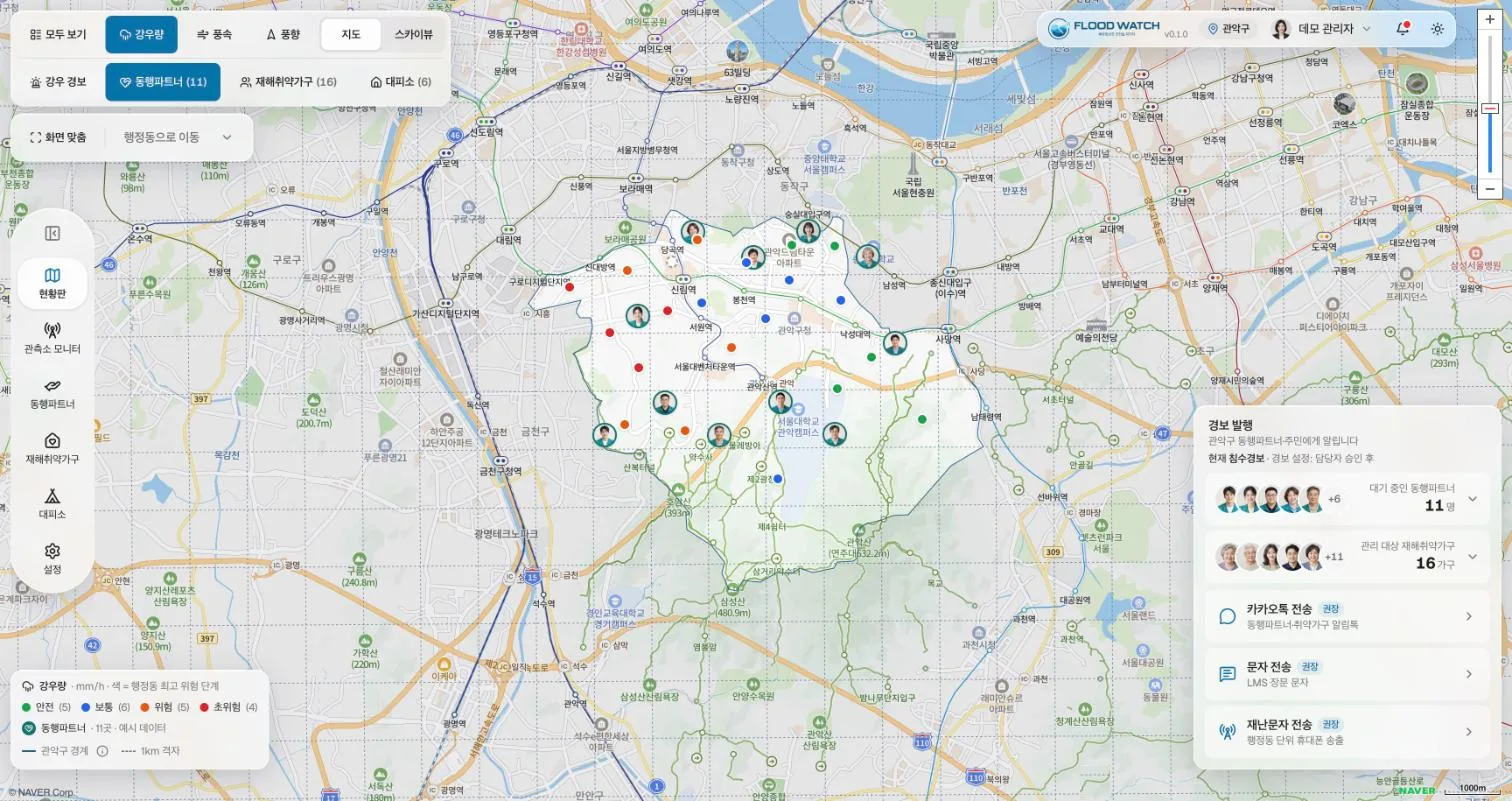
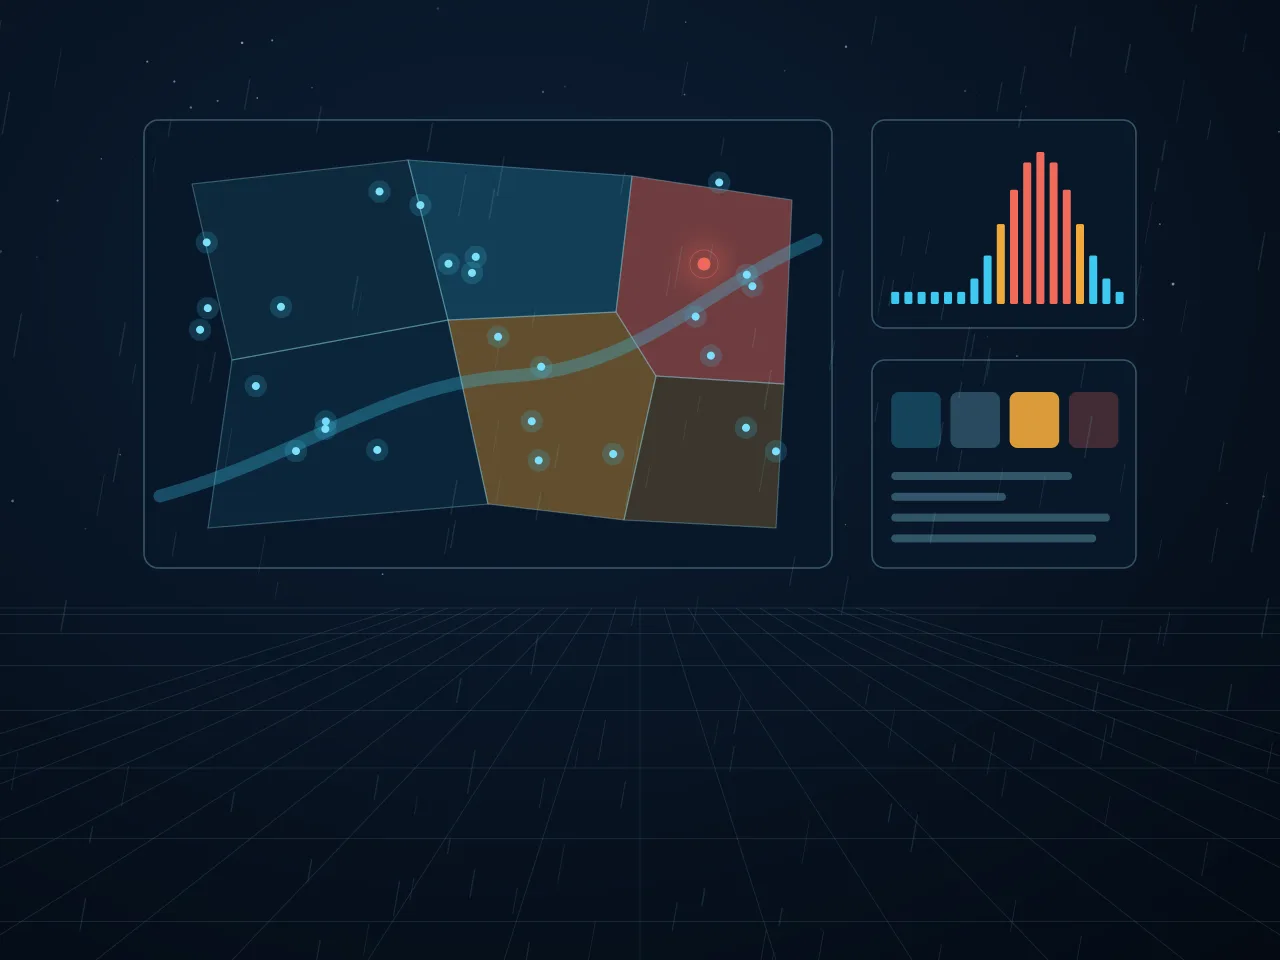
  • Risk level by neighborhood at a glance
  • From partner dispatch to evacuation complete
  • Send alerts straight from the alert panel

了解更多 →

    • Risk level by neighborhood, colored on the map
    • Gauge locations and values on a 1 km grid
    • Send alerts straight from the alert panel
    • Where standby companion partners are
    • Staff closest to risk zones
    • Linked to assigned households
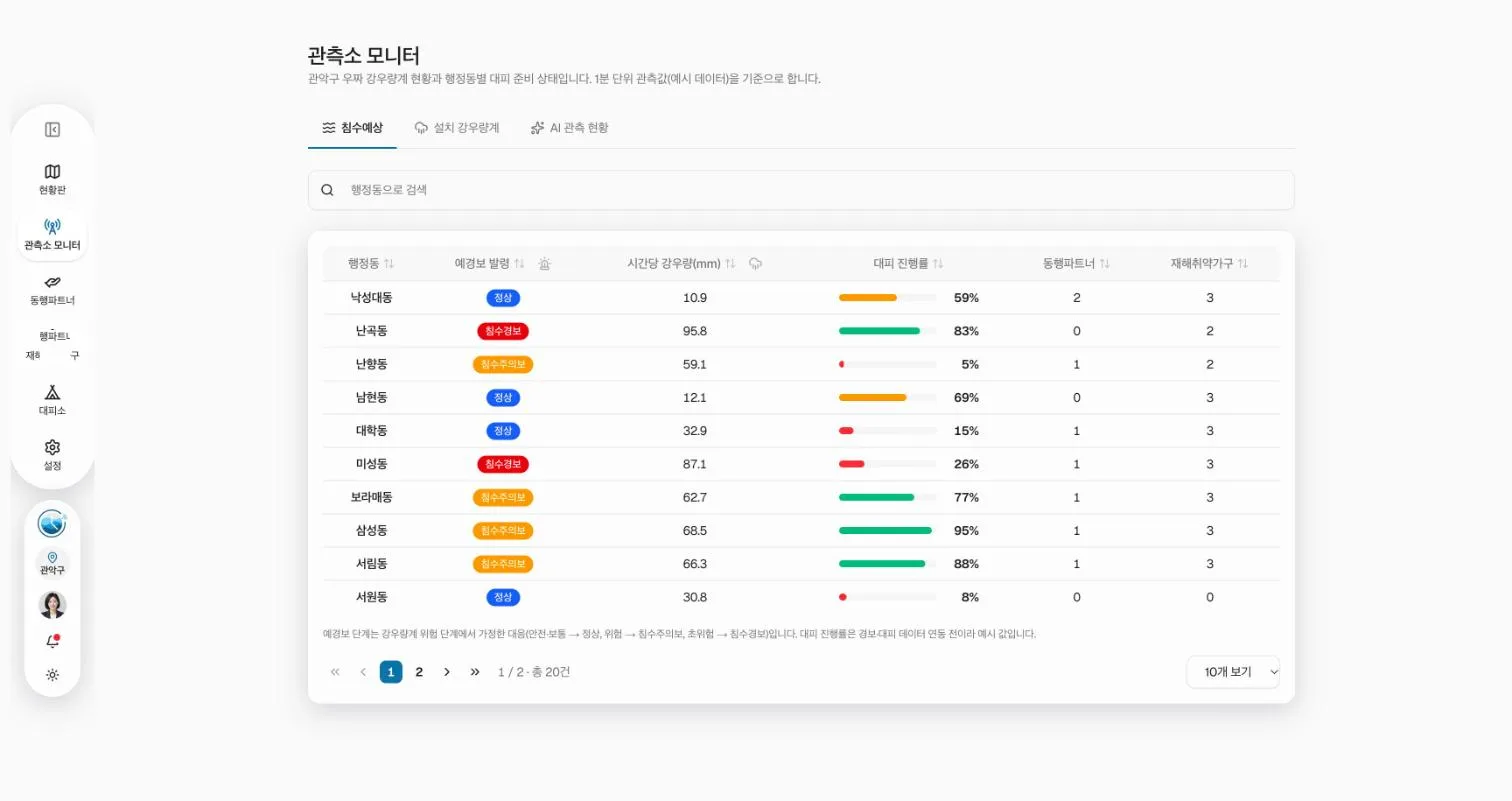
    • Advisory and warning level by neighborhood
    • Hourly rainfall
    • Evacuation progress, live
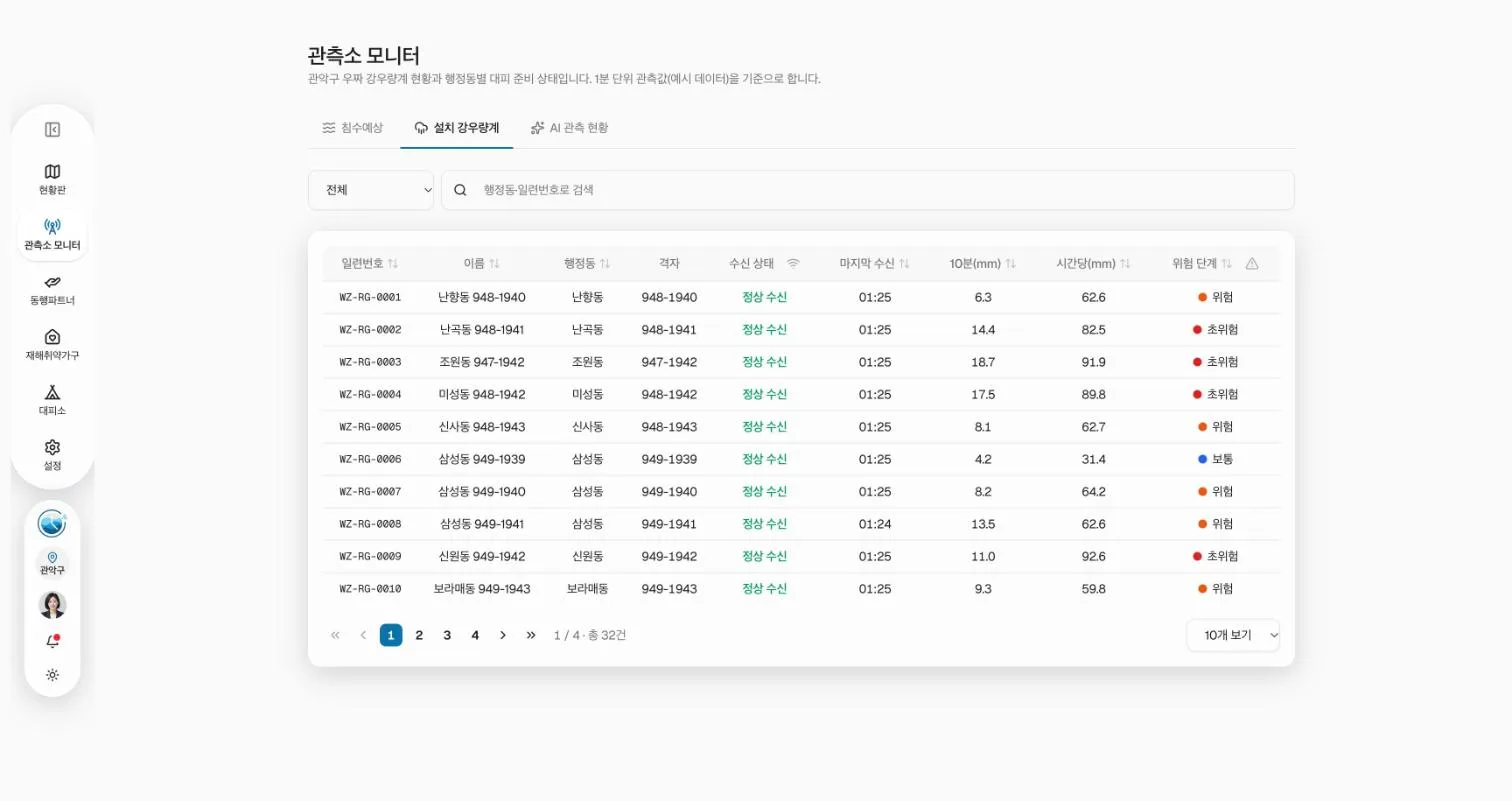
    • Link status and last reading per device
    • 10-minute and hourly rainfall
    • Risk level per device
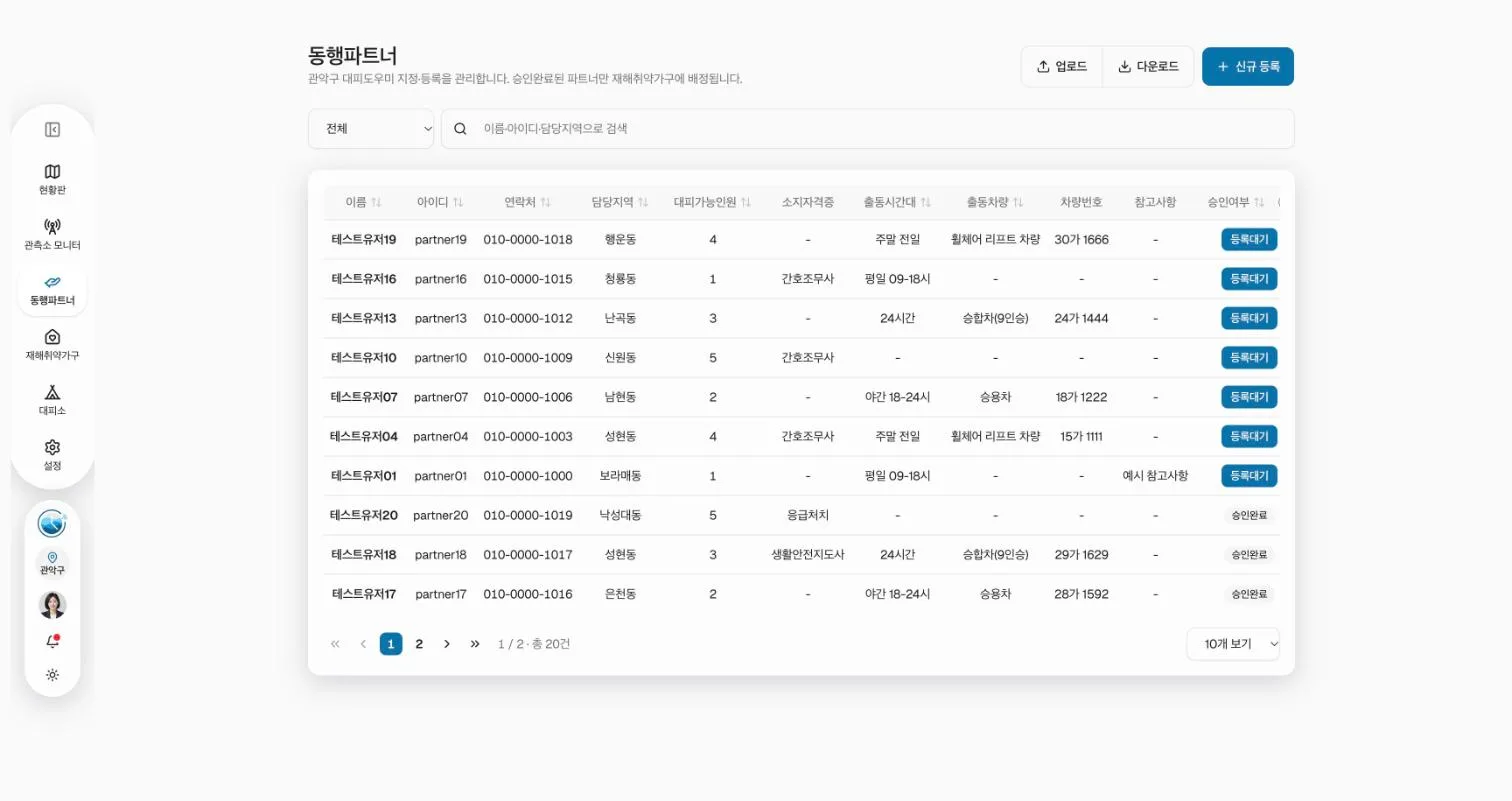
    • Area, availability and vehicle
    • Assigned to households after approval
    • Bulk upload from spreadsheets
    • Facility type and capacity
    • Assigned people and contact
    • Linked to households and partners
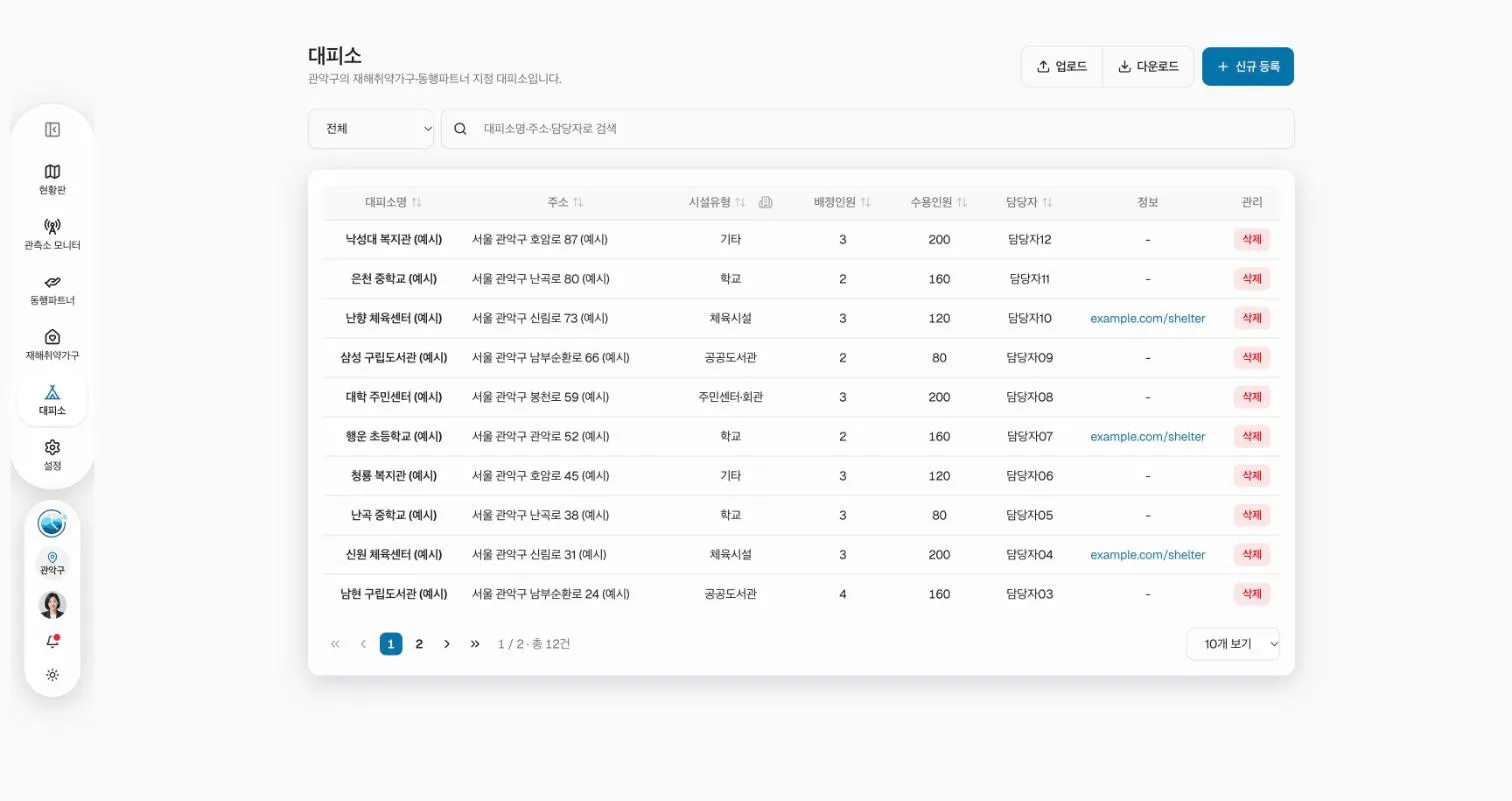
Flood Watch screen: Live mapFlood Watch screen: Partner positionsFlood Watch screen: Flood outlook & evacuationFlood Watch screen: Installed gaugesFlood Watch screen: Partner managementFlood Watch screen: Shelters
Flood Watch demo · sample data

Field Rainfall Data API

Field rainfall, one API call away.

  • Neighborhood-level points, every minute
  • Raw/corrected status and quality flags
  • Webhook alerts on thresholds
cURL200 OK
curl "$WOOZZA_API/v1/observations/latest?station=WZ-RG-0002" \
  -H "Authorization: Bearer $WOOZZA_API_KEY"
{
  "station_id": "WZ-RG-0002",
  "observed_at": "2026-10-17T01:25:00+09:00",
  "rain_10min_mm": 14.4,
  "rain_1h_mm": 82.5,
  "quality": { "status": "corrected" },
  "risk_level": 4
}

06Observation network

從一座城市,走向更多城市。

我們正在首爾冠岳區與紐約布魯克林推動城市層級實證,並持續將觀測網擴大至更多城市。

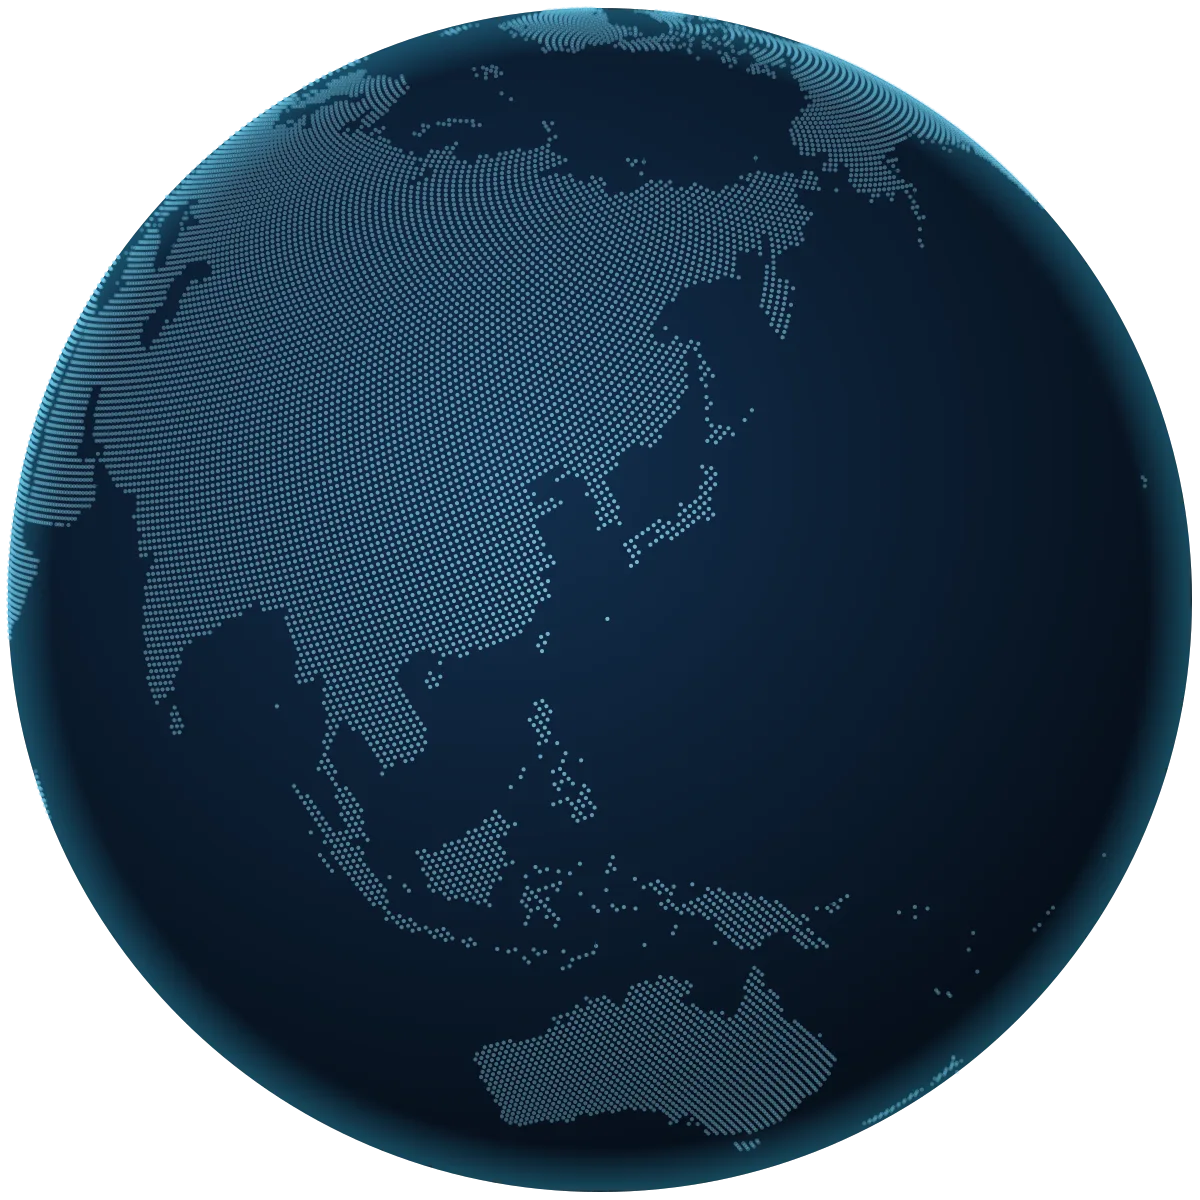
拖曳可旋轉,點選地點或從下方清單選擇地區。

因您已開啟減少動態效果設定,或裝置不支援WebGL,故顯示靜態地球儀與地區清單。

地區清單

大韓民國首爾特別市

首爾冠岳區

實證中2024年起

自2024年起推動市區淹水應對實證。以社區為單位佈設觀測點,並將6公尺網格淹水情境與Flood Watch監控連結。

在現場安裝觀測裝置並運作實證的地區。
美國紐約州

紐約布魯克林

實證中2025年起

自2025年起推動以深度學習為基礎的洪水預測資訊顯示實證。從裝置安裝到即時監控、淹水通報,皆於當地運作。

在現場安裝觀測裝置並運作實證的地區。

美國

加州

規劃中規劃中

正準備以美國西岸實證據點擴展。

依全球擴展藍圖準備實證的地區。

中東

阿拉伯聯合大公國

規劃中規劃中

正準備以中東地區實證據點擴展。

依全球擴展藍圖準備實證的地區。

越南

河內

規劃中規劃中

正準備以東南亞實證據點擴展。

依全球擴展藍圖準備實證的地區。

圖例

  • 實證中
  • 規劃中
  • 虛線:擴展願景概念線

連線與光流是表現擴展構想的圖像,並不代表實際通訊網路或資料介接。

07應用領域

雨成為問題的每一處。

同一份觀測資料,能延伸至符合機構與現場角色的判斷。